Data Analytics for eCommerce: Boost Sales with Power BI Dashboards
Key Insights
- Data helps you understand what customers like and what they ignore.
- Small fixes in data can lead to higher sales and better conversions.
- Many online stores make improper use of their data. It’s a major hindrance in the way of revenue generation.
- Power BI takes data from varied places and puts it in one central place. This leads to strategic decision-making.
- Tracking the metrics that really matter for your business is key to growing it.
Data analytics for eCommerce means using your store’s data to understand what is happening. It’s also used to decide what to do next.
You collect data. You study it. Then you take action.
Today, online stores depend on data. Every click, view, and purchase leaves a trace. That trace tells you what customers like and what they ignore. You also learn where you are losing money.
Basic reporting vs. real analytics
| Type | What it does | Example |
| Basic reporting | Shows what already happened | “Sales were $6,000 last month” |
| Real analytics | Explains why it happened and what to do next | “Sales dropped because mobile users faced checkout issues” |
Why Data Analytics Matters for eCommerce Growth
Data directly affects your revenue. Here is how it impacts growth:
- Sales increase when you promote the right products
- Conversions improve when you fix user experience issues
- Customer retention grows when you understand buying behavior
Examples
- Finding best-selling products helps you restock faster
- Reducing cart abandonment increases completed orders
- Improving ad ROI lowers your marketing costs
Supporting insight
Companies that use customer data well earn more profit. They often perform better than their competitors.
This shows that data is closely linked to revenue growth.
Common Problems eCommerce Businesses Face Without Analytics
Many businesses struggle because they do not use data properly. They face the following:
- Guesswork in marketing leads to wasted ad spend
- Scattered data across platforms like Shopify, ads, etc.
- Delayed decisions. This is a result of unclear data.
- Poor customer understanding. This negatively affects to targeting
What Can You Track with eCommerce Data Analytics?
You can track almost everything. But it’s important to use the right metrics.
A. Sales Metrics
These metrics show how your store performs.
- Revenue
- Average Order Value
- Conversion Rate
B. Marketing Metrics
These show how your campaigns perform.
- Customer Acquisition Cost (CAC)
- Return On Ad Spend (ROAS)
- Traffic Sources
C. Customer Metrics
These help you understand your buyers.
- Lifetime Value (LTV)
- Repeat Purchase Rate
- Customer Segments
D. Operations Metrics
These track backend efficiency.
- Inventory Performance
- Order Fulfillment Time
- Returns
How Power BI Helps in eCommerce Data Analytics
Power BI is a business intelligence dashboard software. It takes raw data and turns it into clear visuals that are easy to understand.
In eCommerce, your data is usually spread across tools. You may have:
- Store data from Shopify or WooCommerce
- ad data from Google Ads and Meta
- Customer data from your CRM
- Spreadsheets in Excel
Managing all this separately can get confusing. Power BI solves this by bringing everything into one place.
It connects with multiple sources like:
- Excel
- SQL databases
- Cloud platforms like Azure
- APIs from eCommerce and marketing tools
Once connected, all your data sits in one dashboard. This gives you a complete view of your business. You do need to switch between tools.
How data is cleaned and prepared
Raw data has missing values and other errors. Power BI uses Power Query to fix this. With it, you can:
- Remove duplicate records
- Fix incorrect data formats
- Merge data from different tables
- Fill missing values
Understanding data with DAX formulas
Power BI uses a formula language called DAX (Data Analysis Expressions). It helps you create custom metrics. For example, you want to calculate total revenue:
Revenue = SUM(Orders[SalesAmount])
If you want to calculate average order value:
AOV = DIVIDE(SUM(Orders[SalesAmount]), COUNT(Orders[OrderID]))
These formulas let you create metrics that match your business needs.
Real-time and scheduled data updates
Data is only useful when it is fresh. Power BI supports different types of data refresh.
| Type | What it means | Use case |
| Near real-time | Data updates within minutes | Live sales tracking |
| Scheduled refresh | Data updates at fixed times (daily or hourly) | Regular reporting |
For example, you can set your dashboard to refresh every hour. This helps you track campaign performance during the day.
Visualizing data in a simple way
Power BI makes data easy to read. Instead of looking at rows of numbers, you see:
- Bar charts for product performance
- Line graphs for sales trends
- Pie charts for traffic sources
- Funnel charts for conversion tracking
This makes patterns easier to spot. Suppose conversions drop suddenly. Here, you will see it instantly on a graph.
How Power BI fits into the Microsoft ecosystem
One big advantage of Power BI is how well it works with other Microsoft tools. Here’s how it connects:
- Excel: Import and analyze spreadsheet data easily
- Azure: Store and process large datasets
- Teams: Share dashboards with your team in real time
This makes collaboration simple.
How to Connect Your eCommerce Data Sources to Power BI
Most businesses who start using Power BI have their data scattered across tools. The change happens when you bring all this data into one place.
That’s what Power BI helps you do. Here’s how.
Main Data Sources You Should Connect
Here are the most important platforms for eCommerce analytics:
| Data Source | What You Get |
| Shopify | Orders, revenue, products, customers |
| GA4 | Website traffic, user behavior, conversions |
| Meta Ads | Campaign performance, clicks, cost, ROAS |
| Google Ads | Search ads data, keywords, conversions |
1. Connecting Shopify to Power BI
Shopify is where your sales happen. So this is your most important data source.
What you can track:
- Total sales and revenue
- Best-selling products
- Customer purchase behavior
- Order trends over time
How to connect:
- Use a Shopify API connector
- Another option is to use third-party tools like data connectors.
2. Connecting Google Analytics (GA4)
GA4 helps you understand what users do on your website.
What you can track:
- Traffic sources (organic, social, paid)
- User journeys
- Bounce rate and engagement
- Conversion paths
How to connect:
- Use GA4 connectors in Power BI
- Or export GA4 data via BigQuery (advanced option)
3. Connecting Meta Ads (Facebook & Instagram)
Meta Ads drive a big part of eCommerce traffic.
What you can track:
- Ad spend
- Clicks and impressions
- Cost per click (CPC)
- Return on ad spend (ROAS)
How to connect:
- Use Meta Ads API connectors
- Or use third-party integration tools
4. Connecting Google Ads
Google Ads brings high-intent traffic. People searching are often ready to buy.
What you can track:
- Keyword performance
- Conversions
- Cost per acquisition (CPA)
- Campaign ROI
How to connect:
- Use Google Ads connectors in Power BI
- Or export data into a database and link it
Once all your data sources are connected, Power BI becomes your single source of truth. It looks like this:
- Shopify shows what people bought
- GA4 shows how they reached your site
- Meta Ads and Google Ads show what campaigns worked
Now, you can get answers to questions like:
- Which channel brings the most revenue?
- Which campaign is wasting money?
- Which products perform best with ads?
Key Power BI Dashboards Every eCommerce Business Needs
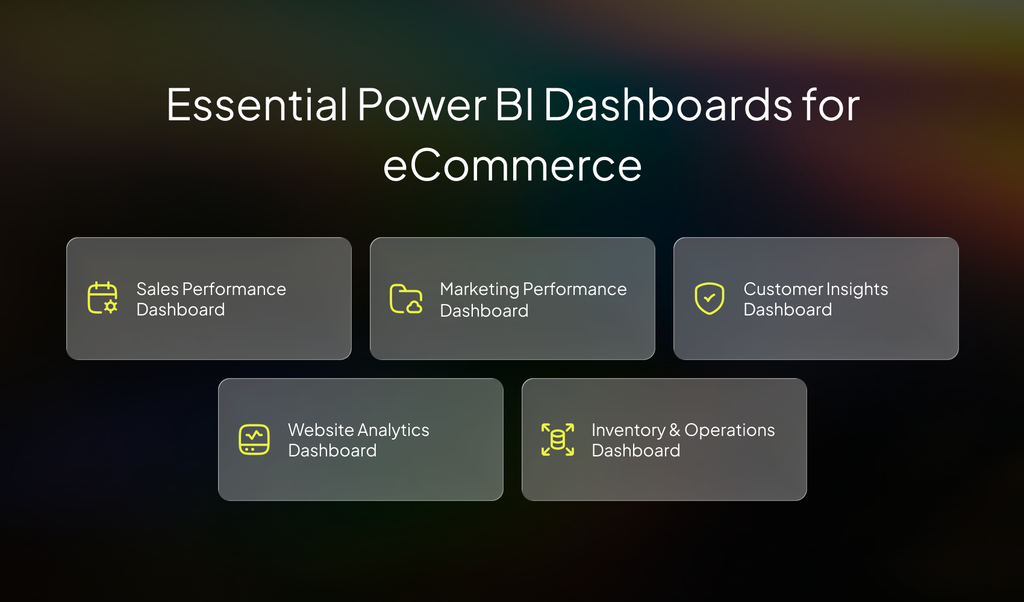
These dashboards bring all your data into one place. When you use them daily, your decisions are more informed.
1. Sales Performance Dashboard
This dashboard focuses on revenue and product performance. It helps you understand how your store is growing over time. It includes:
- Daily and monthly revenue
- Top-selling products
- Sales trends over time
Sample KPIs
- Total revenue
- Average order value (AOV)
- Conversion rate
- Units sold
- Revenue by product category
Best Power BI visuals to use
- Line charts for sales trends over time
- Bar charts for top products
- Cards for total revenue and AOV
- Area charts for growth comparison
2. Marketing Performance Dashboard
This dashboard helps you understand how your marketing efforts are performing. It connects your ad spend with actual results. It shows:
- Ad performance across platforms
- Channel-wise ROI
- Campaign comparison
Sample KPIs
- Customer acquisition cost (CAC)
- Return on ad spend (ROAS)
- Click-through rate (CTR)
- Cost per click (CPC)
- Conversions by channel
Best Power BI visuals to use
- Bar charts for comparing channels
- Stacked charts for campaign performance
- Pie charts for traffic share
- Tables for detailed campaign data
3. Customer Insights Dashboard
This dashboard helps you understand your customers better. It shows who they are and how they behave. It includes:
- New vs. returning customers
- Customer segmentation
- Buying patterns
Sample KPIs
- Customer lifetime value (LTV)
- Repeat purchase rate
- Average purchase frequency
- Customer retention rate
- Revenue by customer segment
Best Power BI visuals to use
- Donut charts for new vs returning users
- Bar charts for customer segments
- Cohort tables for retention analysis
- Line charts for purchase trends
4. Website Analytics Dashboard
This dashboard focuses on how users behave on your website. It helps you find where users drop off and why. It shows:
- Traffic sources
- Bounce rate
- Conversion funnel
Sample KPIs
- Total website sessions
- Bounce rate
- Average session duration
- Conversion rate
- Cart abandonment rate
Best Power BI visuals to use
- Funnel charts for conversion steps
- Line charts for traffic trends
- Pie charts for traffic sources
- Heatmaps (via custom visuals) for engagement
5. Inventory & Operations Dashboard
This dashboard focuses on backend operations. It helps you manage stock and delivery efficiently. It includes:
- Stock levels
- Fast and slow-moving products
- Returns tracking
Sample KPIs
- Inventory turnover rate
- Stock availability
- Order fulfillment time
- Return rate
- Backorder rate
Best Power BI visuals to use
- Bar charts for product movement
- Tables for stock details
- Line charts for inventory trends
- KPI cards for fulfillment time
Turn Your eCommerce Data Into Insights
Power BI Copilot and AI Features for eCommerce (2026 Update)
AI is now a big part of how businesses understand data. With Microsoft Power BI, this shift is very clear. Power BI now includes Copilot and AI features. These make analysis faster and easier.
What is Power BI Copilot?
Power BI Copilot is an AI assistant inside Power BI.
It helps you work with data using simple language. You do not always need complex formulas or technical skills.
You can type a question like:
- “Show me sales by product category”
- “Why did revenue drop last month?”
Copilot will generate:
- charts
- summaries
- insights
This makes data analysis more accessible. It is especially useful for non-technical users.
How AI helps in eCommerce analytics
In eCommerce, speed matters. You need answers quickly. AI features in Power BI help you do that. They can:
- Analyze large datasets in seconds
- Detect patterns that are hard to spot manually
- Highlight unusual trends automatically
- Suggest insights based on your data
For example, if a product suddenly drops in sales, AI can flag it instantly. This helps you act before it becomes a bigger problem.
Key AI features in Power BI
Power BI includes several built-in AI capabilities.
1. Natural language queries
You can ask questions in plain English. Power BI converts them into visuals.
2. AI-generated insights
Power BI can automatically explain trends. For example:
- Why sales increased
- Which factors affected performance
3. Key influencers visual
This feature shows what impacts a metric the most. For example, it can tell you:
- Which customer segment drives higher sales
- Which channels lead to better conversions
4. Decomposition tree
This helps you break down a number step by step.
For example:
- Total revenue → by region → by product → by channel
It helps you find the root cause of changes.
Sample use cases for eCommerce
Here’s how these AI features help in real scenarios.
- Identify why cart abandonment is increasing
- Find which products are trending in specific regions
- Understand which campaigns are driving high-value customers
- Detect sudden drops in conversion rates
These insights help you act faster and improve performance.
AI vs. traditional analytics
| Approach | How it works | Limitation |
| Traditional analytics | Manual analysis using dashboards | Takes time and effort |
| AI-powered analytics | Automated insights and suggestions | Needs clean data to work well |
Things to keep in mind
AI is powerful. But it works best when your data is clean and structured. Follow these simple tips:
- Keep your data accurate and updated
- Use clear naming for metrics and fields
- Validate AI-generated insights before acting
Businesses that adopt AI early can:
- Make faster decisions
- Reduce manual work
- Uncover deeper insights
Predictive Analytics with Power BI for eCommerce
Till now, we talked about understanding past data. Now let’s move one step ahead.
Predictive analytics helps you look into the future. It uses past data to estimate what is likely to happen next.
With Microsoft Power BI, you can build simple forecasts without needing advanced data science skills.
What predictive analytics means for eCommerce
In eCommerce, timing matters a lot. You must know:
- What customers will buy
- When demand will increase
- How much stock you should keep
Predictive analytics helps answer these questions. It uses historical data like:
- Past sales
- Seasonal trends
- Customer behavior
Then it finds patterns and creates forecasts.
How Power BI supports forecasting
Power BI includes built-in forecasting features. These are easy to use and work well for most eCommerce cases. Here is how it helps:
- Uses time-series data to predict future trends
- Automatically detects seasonality in data
- Adjusts forecasts based on past patterns
- Allows you to set forecast length (days, weeks, months)
Demand forecasting made simple
Demand forecasting helps you estimate how much product you will sell.
This is useful because:
- You avoid stockouts
- You reduce excess inventory
- You improve planning
Key metrics to use for demand forecasting
- Historical sales volume
- Product-wise sales trends
- Seasonal demand patterns
- Regional demand differences
Best visuals in Power BI
- Line charts with forecast lines
- Area charts for trend comparison
- Time-series visuals
Understanding seasonal spikes
Most eCommerce businesses see seasonal changes. For example:
- Festive sales
- Holiday shopping spikes
- End-of-season discounts
Power BI can detect these patterns automatically. It looks at repeating trends in your data and highlights them.
What you can do with this insight
- Prepare marketing campaigns in advance
- Stock high-demand products before peak season
- Adjust pricing strategies
Planning inventory with predictions
Inventory planning becomes easier with predictive analytics. You can forecast:
- Which products will sell more
- Which items may slow down
- How much stock is needed
Suppose your data shows that a product sells more every December. Here, you can:
- Increase stock before December
- Avoid last-minute shortages
- Reduce lost sales
Forecast vs. actual comparison
One of the most useful features is comparing forecasts with actual results.
| Metric | What it shows |
| Forecasted sales | Expected future performance |
| Actual sales | Real performance |
| Variance | Difference between expected and actual |
Predictive analytics works best when your data is reliable. Remember the following:
- Use clean and consistent historical data
- Include enough past data for better accuracy
- Review forecasts regularly
When you use predictive analytics, you move from reactive to proactive decisions.
You don’t ask “What happened?” You start asking, “What will happen next?”
This lets you plan better and stock smarter. As a result, you sell more.
How to Build a Power BI Dashboard for eCommerce (Step-by-Step)
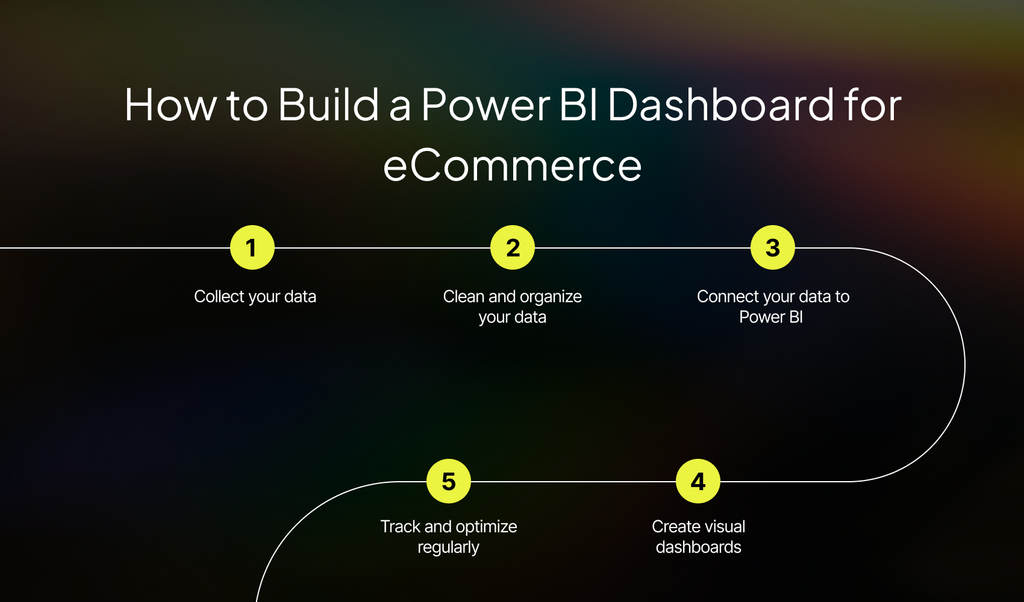
Building a dashboard may sound technical. The stepwise breakdown below will make it easy to understand.
Step 1: Collect your data
Start by gathering all your data in one place.
- Shopify or WooCommerce for store data
- Amazon or marketplaces for orders
- Google Ads and Meta Ads for marketing data
- CRM tools for customer data
- Excel files for manual records
Step 2: Clean and organize your data
Bad data leads to wrong insights. Using Power Query in Microsoft Power BI, you should:
- Remove duplicate entries
- Fix incorrect formats (like dates and currency)
- Handle missing values
- Standardize column names
Step 3: Connect your data to Power BI
Now, connect the data to Power BI. Power BI supports many data sources.
- Excel files
- SQL databases
- Cloud platforms
- APIs from eCommerce tools
You simply import or connect your data. After that, Power BI creates a data model.
This model links different tables together. It helps you analyze everything in one place.
Step 4: Create visual dashboards
You now turn your data into visuals that are easy to understand. Some common visuals you should use:
- Line charts for trends over time
- Bar charts for comparisons
- Pie charts for distribution
- Funnel charts for conversion tracking
- KPI cards for key numbers
Step 5: Track and optimize regularly
You need to use your dashboard regularly. Here’s how to make its best use:
- Check your dashboard daily or weekly
- Track changes in key metrics
- Identify patterns and trends
- Test new strategies based on insights
Case Study: How Imenso Software’s Data Analytics Increased eCommerce Sales
This eCommerce project shows how data analytics improves operations and customer experience.
Project overview
- Industry: eCommerce
- Location: India
- Goal: Analyze order data and improve business performance
The main aim was to turn raw data into useful insights. This was done using an interactive dashboard.
Problem
The eCommerce business faced several challenges.
- Data was not always accurate or consistent
- Customer groups were not clearly defined
- Order fulfillment and delivery delays were not tracked properly
- Product performance was unclear
So, decisions were slow and often based on guesswork.
Solution
Imenso Software built an advanced dashboard using Qlik Sense. This dashboard made complex data simple and easy to grasp.
Core solution features
- Interactive dashboards with charts, graphs, and maps
- Unified data from varied sources into one platform
- Embedded reports inside applications for easy access
Data integration
The dashboard connected multiple data sources. This helped create a single source of truth for the business.
- flat files
- QVD files
- SQL
- Oracle
Customization and usability
The dashboard was designed for clarity and ease of use.
Key improvements
- Color schemes to highlight important trends
- Filters and drill-downs for deeper analysis
- Improved layout for better user experience
Key metrics tracked
The dashboard focused on important eCommerce metrics.
| Area | What was tracked |
| Orders | order status and delivery timelines |
| Customers | segments based on behavior and demographics |
| Products | sales performance and customer feedback |
| Operations | fulfillment time and return rates |
Advanced features
The dashboard included several powerful features:
- Custom KPIs aligned with business goals
- Interactive elements like tooltips and hover details
- Drill-down capabilities to explore deeper insights
- Customizable widgets for flexible views
- Export options like PDF and QVF files
Insights gained
After using the dashboard, the business could:
- Identify delays in order delivery
- Understand different customer segments
- Find top-performing and low-performing products
- Improve inventory planning
Result
The results were clear and measurable:
- Faster decision-making
- Improved order fulfillment process
- Better customer targeting
- Higher customer satisfaction
Best Practices for Using Data Analytics to Boost Sales
Using data is not enough. You need to use it correctly. Here are some practical tips:
- Focus on actionable metrics, not vanity numbers
- Track trends over time instead of single data points
- Test changes regularly and measure results
- Use dashboards daily to stay updated
Final Thoughts: Turn Data into Revenue
The process is simple.
data → insights → decisions → sales
When you use business intelligence dashboard software like Power BI, you stop guessing. You start acting based on facts.
Start small. Track your key metrics. Build your first dashboard. Use the insights daily.
That is how data turns into real revenue growth.
Build Your eCommerce Analytics Dashboard


Similar Posts
Top 10 Data Visualization Tools for 2024
Are you feeling overwhelmed and unable to make sense of the sea of data available? You are not alone. Every day, we generate a large amount of data, about 402.74 million terabytes. And it’s only going to increase! This can be challenging for entrepreneurs, businesses, and individuals, making it difficult to find relevant information. According […]...
How Power BI is Transforming Business Intelligence in 2025?
“Numbers have an important story to tell. They rely on you to give them a clear & convincing voice.” ~ Stephen Few Ever wish your business numbers could just talk to you? In 2025, they can, all thanks to Power BI. What if instead of messy spreadsheets and guesswork, you get crystal-clear dashboards? That’s the […]...
How Power BI Can Simplify Financial Reporting for SMBs?
The significance of data is not new in the present world. However, the real challenge is how to make the best of it to bring profit to the business. If you are also an owner of an SMB, you probably have encountered this problem. Power BI is a comprehensive business intelligence platform that can do […]...