AI-Powered Analytics: Making Data Insights More Intuitive and Actionable
Let’s be honest for a moment.
Most teams today have more data than ever. But they still struggle to make clear decisions.
That gap is the real problem.
The growing gap between data and clarity
Data is everywhere now.
- Product data
- Sales data
- User behavior
- Logs, clicks, events, metrics
But when a leader asks a simple question like: “What should we do next?”
The answer is rarely clear. Instead, they get:
- Charts
- Tables
- Filters
- More dashboards
Why dashboards alone don’t drive action
Dashboards are not useless. They are just incomplete.
Here is why they fall short:
- They show what happened, not why
- They need humans to interpret patterns
- They assume users know what to ask
- They do not suggest next steps
A dashboard might say:
“Revenue dropped 8% last week”
But it won’t tell you:
- Why it dropped
- What caused it
- What will happen next
- What action to take
So teams guess. Or they wait. Or they argue. That is not decision-making. That is delay.
Analytics is not a data problem anymore
For years, companies tried to fix analytics by:
- Adding more tools
- Hiring more analysts
- Building more reports
But the real issue is not access to data. It is reasoning over data.
This is where AI-powered analytics changes the game.
How AI-powered analytics shifts reporting → reasoning
AI-powered analytics does not just report numbers.
It helps you think with your data. Instead of asking:
“What does this chart mean?”
You ask:
“Why did this happen, and what should we do?”
The system helps answer that.
It:
- Finds patterns on its own
- Explains causes in plain language
- Flags risks early
- Recommends actions
Analytics becomes a decision partner, not a passive screen.
What this article will help you understand
By the end of this guide, you will know:
- What AI-powered analytics really means
- How it works in real workflows
- How teams actually use it to decide faster
- Why modern enterprise web application development now depends on it
What Is AI-Powered Analytics? (Clear, Modern Definition)
AI-Powered Analytics uses machine learning, natural language processing, and automation to analyze data, surface insights, explain outcomes, and recommend actions in real time.
Read that again. The key words are:
- Explain
- Recommend
- In real time
How it is different from traditional BI
Traditional BI tools focus on visibility. AI-powered analytics focuses on understanding.
| Area | Traditional BI | AI-Powered Analytics |
| Core job | Show data | Explain data |
| User effort | High | Low |
| Insight discovery | Manual | Automated |
| Questions | Pre-defined | Dynamic |
| Output | Charts | Insights + actions |
BI answers:
“What happened?”
AI answers:
“Why it happened and what to do next.”
How it differs from self-service analytics
Self-service analytics gave users more control. That helped. But it still has limits.
Self-service tools assume:
- Users know what to ask
- Users know how to explore data
- Users have time to analyze
AI-powered analytics removes those assumptions. It:
- Suggests insights without being asked
- Detects anomalies on its own
- Explains trends in simple language
Why static dashboards fall behind
Static dashboards lag behind today because they:
- Update slowly
- Miss weak signals
- Ignore context
- Cannot reason
Where automation and intelligence enter the workflow
AI-powered analytics works inside the workflow. Not as a separate report.
Here is where intelligence shows up:
- Auto-detecting unusual behavior
- Ranking the most important drivers
- Predicting future outcomes
- Turning insights into alerts or tasks
This is a part of:
- Enterprise web application development
- Rapid web application development
- Products built by a progressive web application development company
Why this matters for modern web apps
Today’s users expect answers, not charts. That is why teams building modern apps now ask:
- “Can our product explain itself?”
- “Can users understand data without training?”
- “Can insights show up at the right moment?”
AI-powered analytics makes that possible. It is not about replacing people. It is about helping people decide faster and smarter.
How AI-Powered Analytics Actually Works (Step-by-Step)
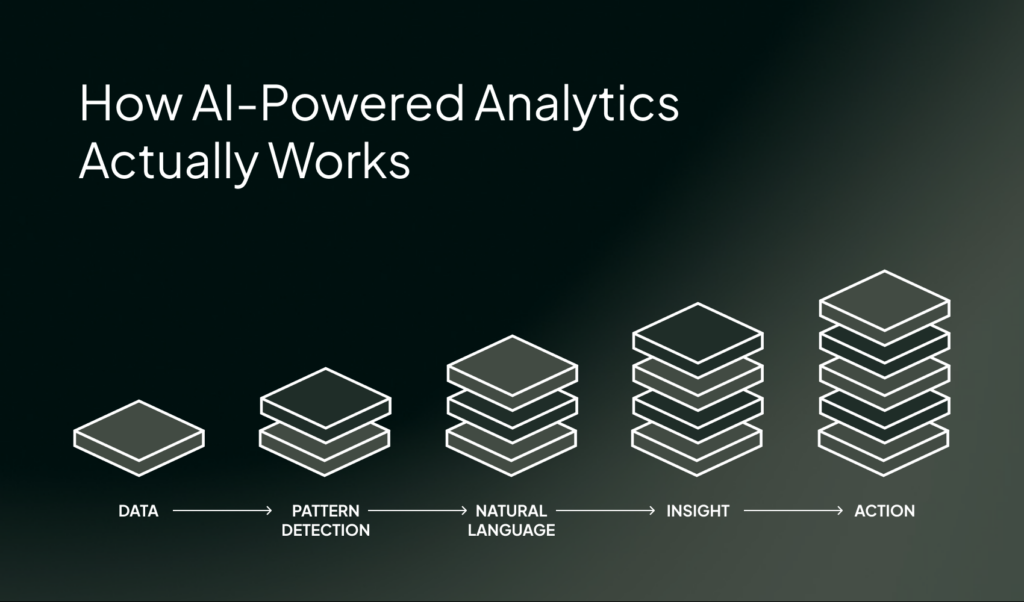
AI-powered analytics involves a clear, repeatable process. Let’s break it down.
3.1 Data Ingestion & Preparation (Structured + Unstructured)
Modern systems pull data from many places at once: these include:
- Databases (SQL, NoSQL)
- APIs from internal systems
- Spreadsheets
- SaaS tools like CRM, ERP, and support tools
- Event logs and app usage data
This is common in enterprise web application development. Most apps already collect this data. They just don’t connect it well.
Structured vs unstructured data
Structured data differs from unstructured data.
- Structured data
Tables, rows, numbers, timestamps - Unstructured data
Text, comments, tickets, feedback, logs
Traditional analytics mostly ignores unstructured data. AI-powered analytics does not.
Automatic cleaning and normalization
This is the part humans hate. But AI systems can handle it well. They help by:
- Removing duplicates
- Fixing missing values
- Aligning formats and units
- Normalizing data across sources
So instead of arguing about “bad data,” teams can focus on meaning. This is a big reason why teams building products fast prefer AI-powered analytics during rapid web application development.
3.2 Machine Learning & Pattern Detection
Once the data is ready, machines learning enters. ML helps in the following ways:
Trend discovery
The system looks for patterns that humans can miss. These include:
- Slow growth over time
- Sudden drops or spikes
- Seasonal behavior
- Long-term shifts
Anomaly detection
This is one of the most useful features. AI-powered analytics can spot:
- Unusual user behavior
- Unexpected revenue changes
- Performance issues
- Silent failures
AI-powered analytics pinpoint the above things without working under any fixed rules. That means it adapts as your product changes.
Correlation vs causation awareness
Good systems do not blindly say:
“A caused B”
Instead, they:
- Show relationships
- Rank likely drivers
- Explain confidence levels
They help humans reason better, not jump to bad conclusions. In enterprise web application development, this helps with building an efficient solution.
3.3 Natural Language & Human-Friendly Queries
This is where analytics starts to feel… human.
Asking questions in plain English
No SQL.
No filters.
No training.
You can ask things like:
- “Why did sign-ups drop last week?”
- “Which users are most likely to churn?”
- “What changed after the last release?”
AI explains the answer
The real power of AI lies in how it explains. It doesn’t gives you charts and tables. That’s why the experts of a progressive web application development company rely on AI analytics so much. It gives them:
- A short summary
- Key drivers ranked by impact
- Supporting data points
3.4 Insight Generation → Recommended Actions
Insights without action are meaningless. AI-powered analytics provides a recommended action plan.
First: “What changed?”
The system identifies:
- What moved
- When it moved
- How big the change was
Then: “Why it changed”
It explains:
- Key contributing factors
- Related events
- Behavioral shifts
Finally: “What to do next”
This is the differentiator. Recommendations might include:
- Fixing a broken flow
- Targeting a user segment
- Rolling back a change
- Testing a specific idea
What Makes AI-Powered Analytics Intuitive (Not Just Powerful)
If only experts can use a tool, it slows everyone down. That is why intuitive matters so much. AI-powered analytics works because it fits how humans think. Let’s explore this further.
Natural language search
This is the first thing people notice. As a user, you don’t have to navigate the system’s interface. Instead, you just ask.
- “Why are users leaving this page?”
- “What changed after the last update?”
- “Which feature drives the most value?”
The system understands intent, not just keywords. This removes fear and friction.
Especially for non-technical teams. This ease is especially good in enterprise web application development, where many roles depend on the same data.
Auto-generated insights
AI-powered analytics does not wait for your questions. It watches the data and speaks up when something matters. It speaks when it sees these types of changes through data:
- A sudden drop in conversion
- A spike in support tickets
- A slow trend that signals future risk
This saves time and mental energy. It keeps teams focused on what truly matters.
Smart alerts instead of manual monitoring
Traditional monitoring is exhausting. The team constantly:
- Check dashboards daily
- Set fixed thresholds
- Miss subtle changes
AI-powered analytics uses smart alerts. These alerts:
- Adapt to normal behavior
- Trigger on meaningful change
- Reduce noise
So teams stop staring at screens. They start responding at the right moment. This works especially well during rapid web application development, where things change fast.
Contextual explanations, not just charts
Charts show patterns. They do not explain them. AI-powered analytics adds context. It answers questions like:
- What caused this?
- Why now?
- Which factors matter most?
Instead of guessing, users get clarity. This makes insights feel trustworthy, not confusing.
Why “intuitive” is not a soft feature
Intuitive does not mean simple-minded. It means:
- Less effort
- Faster understanding
- Better decisions
That is why teams working with a progressive web application development company often demand this level of experience. They want analytics that helps, not make their work more complex.
Traditional Analytics vs AI-Powered Analytics
| Traditional Analytics | AI-Powered Analytics |
| Static dashboards | Dynamic insights |
| Manual queries | Conversational |
| Historical focus | Predictive + prescriptive |
| Expert-only | Business-user friendly |
From Insights to Action: How AI Analytics Drives Decisions
Insights are nice. But insights alone do not change anything. What teams really need are decision-ready insights. These are the insights that lead straight to action.
This is where AI-powered analytics truly earns its place. Here’s how.
Real-time recommendations
AI-powered analytics looks at what is happening right now. When something changes, the system responds quickly. It can:
- Recommend a fix
- Suggest an adjustment
- Flag a risk before it grows
For example:
- A drop in checkout success triggers a suggestion to review a recent UI change
- A surge in traffic prompts a scaling recommendation
These are not random tips. They are based on patterns, history, and context.
Scenario simulations: “What if revenue drops 5%?”
Good decisions consider the future. AI-powered analytics helps teams explore it safely.
Scenario simulation lets you ask:
- “What if churn increases next month?”
- “What if revenue drops 5%?”
- “What if we roll out this feature to all users?”
The system estimates outcomes based on existing data. It does not promise certainty.
It provides direction. This is incredibly useful in enterprise web application development, where one decision can affect thousands of users.
Decision confidence scoring
Not all insights are equal. Some are strong. Some are weak. AI-powered analytics makes that clear.
It often assigns confidence levels based on:
- Data volume
- Pattern strength
- Historical accuracy
So instead of blindly trusting a result, teams can ask:
“How confident should we be in this?”
Alerts that explain impact, not just change
Most alerts are not helpful. For example, they tell you:
“Metric X changed”
But they don’t tell you what exactly you can do about it.
AI-powered analytics goes further. It explains:
- What changed
- Why it matters
- Who or what it affects
- What the likely outcome is
This is actionable context. Instead of making teams panic, it helps them respond calmly and correctly.
The role of “next-best action”
One of the most powerful ideas in AI-powered analytics is the next-best action. It answers:
“Given everything we know, what should we do next?”
This could be:
- Test a hypothesis
- Fix a specific flow
- Reach out to a user group
- Delay a risky release
Not a command. A smart suggestion. That gentle guidance helps teams move faster without losing control.
Why actionability wins trust
When analytics helps people act, they keep using it. When it only shows data, they stop looking.
That is why modern teams, especially those working with a progressive web application development company, expect analytics to be part of decision-making, not just reporting.
Make Your Data Work Smarter
Real-World Use Cases Across Teams (Not Just Industries)
AI-powered analytics is used by teams every day. Across roles. Across functions. Let’s look at how different teams actually use it.
Leadership: strategic forecasting and risk visibility
Leaders rarely need raw numbers. They need clarity. AI-powered analytics helps leadership teams by:
- Forecasting trends early
- Highlighting risks before they grow
- Showing trade-offs between decisions
In web application development, instead of asking for reports, leaders see:
- What is likely to happen next
- What could go wrong
- Where attention is needed now
Sales: pipeline health and deal risk
Sales is a competitive domain. Deals either move rapidly or stall fully. AI-powered analytics helps sales teams:
- Spot deals at risk
- Understand pipeline health
- Predict close probability
It looks at patterns like:
- Deal age
- Activity levels
- Past outcomes
Then it surfaces insights like:
- “This deal looks likely to slip”
- “This segment is closing faster than usual”
Marketing: attribution and campaign optimization
Marketing data is messy. There are various channels and long user journeys. This leads to delayed results. AI-powered analytics helps by:
- Connecting touchpoints
- Improving attribution accuracy
- Identifying high-impact campaigns
Finance: revenue forecasting and anomaly detection
Finance teams care about precision. AI-powered analytics supports them by:
- Forecasting revenue more accurately
- Flagging unusual transactions
- Detecting sudden cost changes
It helps answer:
- “Is this variance normal?”
- “Should we be concerned?”
- “What changed underneath?”
Operations: bottleneck prediction
Operations teams are challenged everyday by delays, dependencies and hidden slowdowns. AI-powered analytics helps operations by:
- Predicting bottlenecks
- Highlighting weak points
- Showing downstream impact
AI-Powered Analytics vs Augmented Analytics vs Predictive Analytics
These terms sound similar. Sometimes they are even used interchangeably.
But they are not the same thing.
Predictive analytics
Predictive analytics focuses on the future. It uses historical data to:
- Forecast outcomes
- Estimate probabilities
- Predict trends
Common examples:
- Revenue forecasts
- Churn prediction
- Demand planning
Predictive analytics answers:
“What is likely to happen?”
It is helpful, but has a narrow scope.
Augmented analytics
Augmented analytics helps users explore data more easily. It adds automation to tasks like:
- Data prep
- Insight discovery
- Visualization suggestions
It reduces manual effort. Augmented analytics answers:
“Here is something interesting you might want to look at.”
It supports analysis. But it does not fully guide decisions.
AI-powered analytics
AI-powered analytics brings everything together. It combines:
- Predictive models
- Augmented discovery
- Natural language understanding
- Automated reasoning
- Action recommendations
It answers:
- “What happened?”
- “Why did it happen?”
- “What will happen next?”
- “What should we do now?”
Where they overlap
These approaches build on each other. Here is how they connect:
- Predictive analytics is a capability
- Augmented analytics is a layer of assistance
- AI-powered analytics is the system that uses both
Many AI-powered analytics platforms include:
- Predictive forecasts
- Automated insights
- Human-friendly explanations
But not all predictive or augmented tools deliver AI-powered analytics.
Side-by-side comparison
| Aspect | Predictive Analytics | Augmented Analytics | AI-Powered Analytics |
| Primary focus | Forecasting | Assisted analysis | Decision support |
| Key strength | Future trends | Ease of use | End-to-end insight |
| User effort | Medium | Low | Very low |
| Natural language | Rare | Limited | Core feature |
| Action guidance | No | Limited | Yes |
Why this matters for modern applications
Modern apps evolve fast. During rapid web application development, teams cannot afford tools that:
- Only show history
- Require constant manual setup
- Depend on expert users
AI-powered analytics adapts as the product grows.
That is why many teams working with a progressive web application development company now treat it as a core capability, not an add-on.
Key Capabilities to Look for in an AI-Powered Analytics Platform
Once teams understand AI-powered analytics, the next question is:
“What should we actually look for?”
Below are the capabilities that truly matter.
Natural language querying
A strong platform should let users:
- Ask questions in plain English
- Avoid complex filters or queries
- Explore data without training
Explainable AI
Explainable AI means the system:
- Shows why a result happened
- Highlights key drivers
- Shares confidence levels
Predictive and prescriptive analytics
A solid AI-powered analytics platform should support:
- Predictive analytics (what is likely to happen)
- Prescriptive analytics (what to do about it)
Look for systems that:
- Suggest next-best action
- Compare possible outcomes
- Help prioritize decisions
Real-time processing
A platform should handle:
- Live data streams
- Near real-time updates
- Fast response to change
If insights arrive too late, they lose value. This is especially important during rapid web application development, where product behavior shifts quickly.
Embedded analytics
Analytics should should live inside the product. Embedded analytics allows:
- Insights within workflows
- Context-aware decisions
- Better user experience
This is now a standard expectation when working with a progressive web application development company. Users want answers where they work.
Custom dashboards and data storytelling
Dashboards still matter. But they should be:
- Flexible
- Role-based
- Narrative-driven
Good platforms support:
- Custom views by role
- Clear storytelling
- Visuals with context
Governance and data security
An enterprise-ready platform should support:
- Role-based access
- Data lineage
- Audit trails
- Compliance needs
A quick buyer-centric checklist
Here is a simple way to evaluate platforms:
- Can non-technical users ask questions?
- Does the system explain its answers?
- Does it recommend actions?
- Does it work in real time?
- Can it embed into products?
- Can teams tell a clear data story?
- Is data governed and secure?
If the answer is “yes” to most of these, you are on the right path.
AI Analytics Platforms: A Real-World Comparison
| Platform | Pricing Model | NLP Capabilities | Deployment Options | Ideal Team Size | Integration Capabilities |
| Tableau AI | Enterprise license-based | Moderate | Cloud + On-prem | Mid to large teams | Strong BI ecosystem |
| Power BI Copilot | Subscription (Microsoft ecosystem) | Moderate | Cloud-first | Small to enterprise | Deep Microsoft stack |
| ThoughtSpot Spotter | Enterprise SaaS | Strong | Cloud + Hybrid | Mid to large teams | Modern data stacks |
| IBM Watson Analytics | Enterprise pricing | Strong | Cloud + On-prem | Large enterprises | Complex enterprise systems |
| Qlik | Enterprise licensing | Moderate | Cloud + On-prem | Mid to large teams | Broad connectors |
| Sisense | Enterprise SaaS | Moderate | Cloud + Embedded | Product teams | Strong embedded analytics |
Which AI Analytics Platform Is Right for You?
- Best for large enterprises:
IBM Watson Analytics
Strong governance, deep AI, enterprise control - Best for Microsoft-based teams:
Power BI Copilot
Works smoothly inside existing Microsoft systems - Best for search-first analytics:
ThoughtSpot Spotter
Great for natural language data search - Best for embedded analytics in products:
Sisense
Strong fit for SaaS and product-led teams - Best for flexible BI ecosystems:
Qlik and Tableau AI
Solid for traditional analytics environments - Best for startups and fast-moving teams:
Julius AI
Lightweight, fast, and easy to adopt
Common Challenges and How AI-Powered Analytics Solves Them
Let’s slow down for a moment.
Analytics has promised clarity for years. Yet many teams still struggle.That is not because teams are bad at data. It is because analytics tools often fall short.
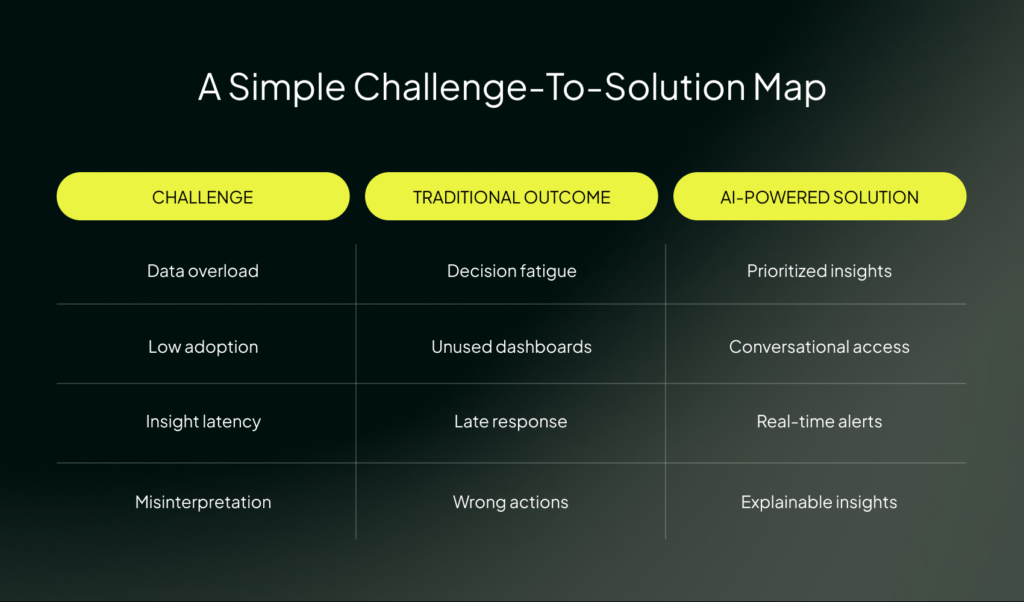
Challenge 1: Data overload
Most teams are drowning in data. They have:
- Too many dashboards
- Too many metrics
- Too many reports
The problem:
More data does not equal better decisions.
How AI-powered analytics helps:
- Filters noise automatically
- Highlights what matters most
- Surfaces insights, not raw numbers
Challenge 2: Low analytics adoption
Many analytics tools look impressive. But they go unused. This happens because they are:
- Too complex
- Too technical
- Too disconnected from daily work
The problem:
If people avoid the tool, insights die.
How AI-powered analytics helps:
- Uses natural language queries
- Delivers insights automatically
- Fits into existing workflows
This makes analytics feel helpful, not intimidating. That is critical in enterprise web application development, where many roles need access without training.
Challenge 3: Insight latency
Traditional analytics is slow. By the time a report is ready:
- The situation has changed
- The opportunity is gone
- The problem has grown
The problem:
Late insight is almost as bad as no insight.
How AI-powered analytics helps:
- Processes data in near real time
- Detects issues early
- Triggers smart alerts
This supports fast response during rapid web application development, where timing matters.
Challenge 4: Misinterpretation of data
Charts can mislead. Without context, teams:
- Jump to wrong conclusions
- Confuse correlation with causation
- Argue instead of act
The problem:
Bad interpretation leads to bad decisions.
How AI-powered analytics helps:
- Explains why changes happened
- Ranks contributing factors
- Provides confidence levels
The Future of AI-Powered Analytics
AI-powered analytics is moving in the direction of providing users with faster clarity and decision-making insights. Here is what is coming next.
Decision intelligence becomes the core
Analytics is shifting from insight to judgment. This shift is often called decision intelligence. It focuses on:
- Framing decisions clearly
- Weighing trade-offs
- Supporting human choice
Autonomous analytics handles the routine
Many analytics tasks are repetitive. These are moving toward autonomous analytics. That means systems will:
- Monitor data on their own
- Detect change automatically
- Surface insights without prompts
Humans step in when judgment is needed. This reduces cognitive load, especially in large enterprise web application development environments.
AI copilots for business users
One of the most important changes is who analytics is for. Not just analysts. AI copilots are emerging for:
- Product managers
- Marketers
- Sales leaders
- Operations teams
These copilots:
- Answer questions in natural language
- Explain outcomes step by step
- Suggest next-best action
They sit beside the user, not above them. That makes analytics feel supportive, not demanding.
From dashboards to workflows
Dashboards are not going away. But they are no longer the center. Analytics is moving into:
- Product interfaces
- Approval flows
- Planning tools
- Daily work systems
Insights appear:
- At the moment of action
- In the right context
- With clear recommendations
Getting Started: How to Implement AI-Powered Analytics Successfully
Getting started with AI-powered analytics does not mean rebuilding everything. It means starting smart. Here is how to do it right.
Start with decision questions, not dashboards
This is the most important rule. Do not begin with:
- “What charts do we need?”
- “What metrics should we track?”
Begin with:
- “What decisions are hard today?”
- “Where do we hesitate?”
- “What do we wish we knew sooner?”
Good examples of decision questions:
- “Should we ship this feature now or wait?”
- “Which customers need attention this week?”
- “What risk is growing quietly?”
Choose high-impact use cases first
Do not try to cover everything at once. Pick areas where:
- Decisions are frequent
- Mistakes are costly
- Data already exists
Common starting points include:
- Churn risk
- Revenue forecasting
- Funnel drop-offs
- Operational delays
Train users to trust insights
Even good insights can be ignored if users do not understand them. To build trust:
- Show explanations alongside results
- Share confidence levels
- Encourage questions
Let users explore “why,” not just “what.”
Over time, people stop double-checking everything. They start acting. This is crucial in enterprise web application development, where adoption determines success.
Balance automation with human oversight
AI-powered analytics should not run unchecked. Best practice looks like this:
- AI handles detection and recommendations
- Humans handle judgment and accountability
Set clear boundaries:
- When AI can act automatically
- When approval is required
- When humans override the system
A simple implementation mindset
Think of implementation as a loop:
- Ask a clear decision question
- Apply AI-powered analytics
- Review insights with users
- Act and observe results
- Refine the approach
Technical Implementation Roadmap
AI-powered analytics works best when it is built step by step. Here is a clean, practical roadmap teams can actually follow.
Phase 1: Data infrastructure assessment
Timeline: 2–4 weeks
Before any AI, you need clarity on data. Focus areas:
- Data sources
- Data quality
- Data ownership
- Data flow
Key setup steps:
- Build or refine a data warehouse
- Create a semantic layer so data has shared meaning
- Align definitions (revenue, churn, active users, etc.)
Phase 2: Tool selection checklist
Timeline: 1–2 weeks
Now you choose the platform. Use a clear checklist. Ask:
- Does it support natural language queries?
- Does it explain insights clearly?
- Does it provide predictive and prescriptive analytics?
- Can it work in real time?
- Can it embed into products?
- Does it support governance and security?
- Does it integrate with our current stack?
Phase 3: Pilot program
Timeline: 3–6 weeks
Pick one high-impact use case. Good pilot examples:
- Churn prediction
- Revenue forecasting
- Funnel drop-off detection
- Ops bottleneck alerts
Track clear KPIs:
- Decision speed
- Error reduction
- Response time
- User adoption
- Action taken per insight
Phase 4: Change management and training
Timeline: 2–4 weeks (ongoing after)
Focus on:
- Simple training
- Role-based onboarding
- Clear use cases
- Trust-building sessions
Teach people:
- How to ask questions
- How to read insights
- How to challenge results
- How to act on recommendations
Phase 5: Scaling and optimization
Timeline: Ongoing
Once the pilot works, expand. Scale across:
- Teams
- Departments
- Products
- Workflows
Optimize by:
- Refining models
- Improving data quality
- Expanding use cases
- Embedding insights deeper
Simple timeline view
| Phase | Focus | Time |
| Phase 1 | Data foundation | 2–4 weeks |
| Phase 2 | Tool selection | 1–2 weeks |
| Phase 3 | Pilot program | 3–6 weeks |
| Phase 4 | Training & adoption | 2–4 weeks |
| Phase 5 | Scale & optimize | Ongoing |
Turning Data into Decisions
For years, analytics focused on:
- Reports
- Dashboards
- Metrics
But that only got us halfway. AI-powered analytics completes the journey. What sets AI-powered analytics apart is not complexity.
It is clarity. When analytics feels intuitive, people use it. When it is actionable, people trust it. That combination is the real differentiator.
Imenso Software helps teams turn analytics into real decisions. We build smart, scalable systems where AI-powered analytics is part of the product, not a side tool. From enterprise web application development to rapid web application development, our focus is on clarity, action, and real business outcomes.
Turn Data Into Better Decisions


Similar Posts

How Predictive Analytics Enhances Decision-Making with Power BI
Are you tired of making business decisions based on gut feelings or outdated information? Are you struggling to stay ahead of the competition in an increasingly data-driven world? If so, you’re not alone. Many business professionals face the challenge of harnessing the power of data to make accurate forecasts and drive their organizations forward. That’s […]...
Is Power BI Right for Your Startup? Evaluation Checklist
“Information is the oil of the 21st century, and analytics is the combustion engine,” Peter Sondergaard, Gartner Research. For a startup to succeed, it needs powerful apps. Data solutions that help it meet the expanding demands are critical for growth. Power BI is one such tool that enables startups to thrive. The business intelligence software […]...
Power BI for Non-Tech Executives: A Simple Guide to Smarter Business Decisions
Millions saw the apple fall, but Newton was the one who asked why. ~ Bernard Baruch Ever looked at a sea of numbers and thought, There must be a better way to make sense of this? You’re not alone! Because data isn’t just for data scientists; it’s for everyone! The Microsoft Power BI is a […]...