Top DAX Functions Every Analyst Should Know in Power BI

Power BI is an advanced data analytics tool. Armed with robust business intelligence capabilities, it enables organizations to glean insights from data. Over 5 million people globally use this BI tool for business analytics.
DAX (Data Analysis Expressions) is a function library in Power BI. Using it, you can implement dynamic data management. DAX for Power BI is critical for every analyst. It helps you perform complex calculations and data manipulations with ease. So, DAX simplifies working with Power BI. It also enhances an analyst’s data processing and analysis abilities.
What is DAX in Power BI?
DAX are expressions and formulas. Power BI users use DAX to analyze and calculate data. DAX has various parts. These include operators, functions, and constraints. All of it is combined into one formula. Then it is assessed to give a result. The result can be in the form of value(s).
Every bit of code in DAX is a function.
DAX formulas work with two data types. These are numeric and non-numeric. Examples of numeric data types are decimals, integers, etc. Binary and string objects are examples of non-numeric data types.
Assessing DAX expressions starts at the innermost function. It continues to the outermost function. Then, it’s critical to build a DAX formula. When this formula is used, it converts any values of a different data type than what it was built for. It means that the DAX formula automatically casts the output values to the defined data type.
How Does DAX Work in Power BI?
Power BI DAX is used to specify and manage calculations within data models. These calculations are quite helpful. You can use them to create calculated measures and columns. Then, use it to develop interactive visualizations. DAX works directly with Power BI’s tabular models. The tabular models are optimized for data analysis.
Measures and calculated columns are two core tools for data analysis in DAX.
Measures
Measures are calculations that are evaluated in real time. This occurs in the context of the report. Measures are used in visualizations. They adjust to the filters or any specific selections applied. As an example, a measure can compute gross monthly sales based on the product and date filters active in the report.
Calculated Columns
Calculated columns are computed for every row of a table. They are stored as part of the data model. You can use the columns to add new data to existing ones. For example, a calculated column can classify products based on their price range.
Top 10 Power BI DAX Functions
DAX helps you work with big datasets and perform lengthy and tough calculations. It simplifies the task of creating data models for business intelligence and reporting. Below are the top 10 DAX functions in Power BI you must know.
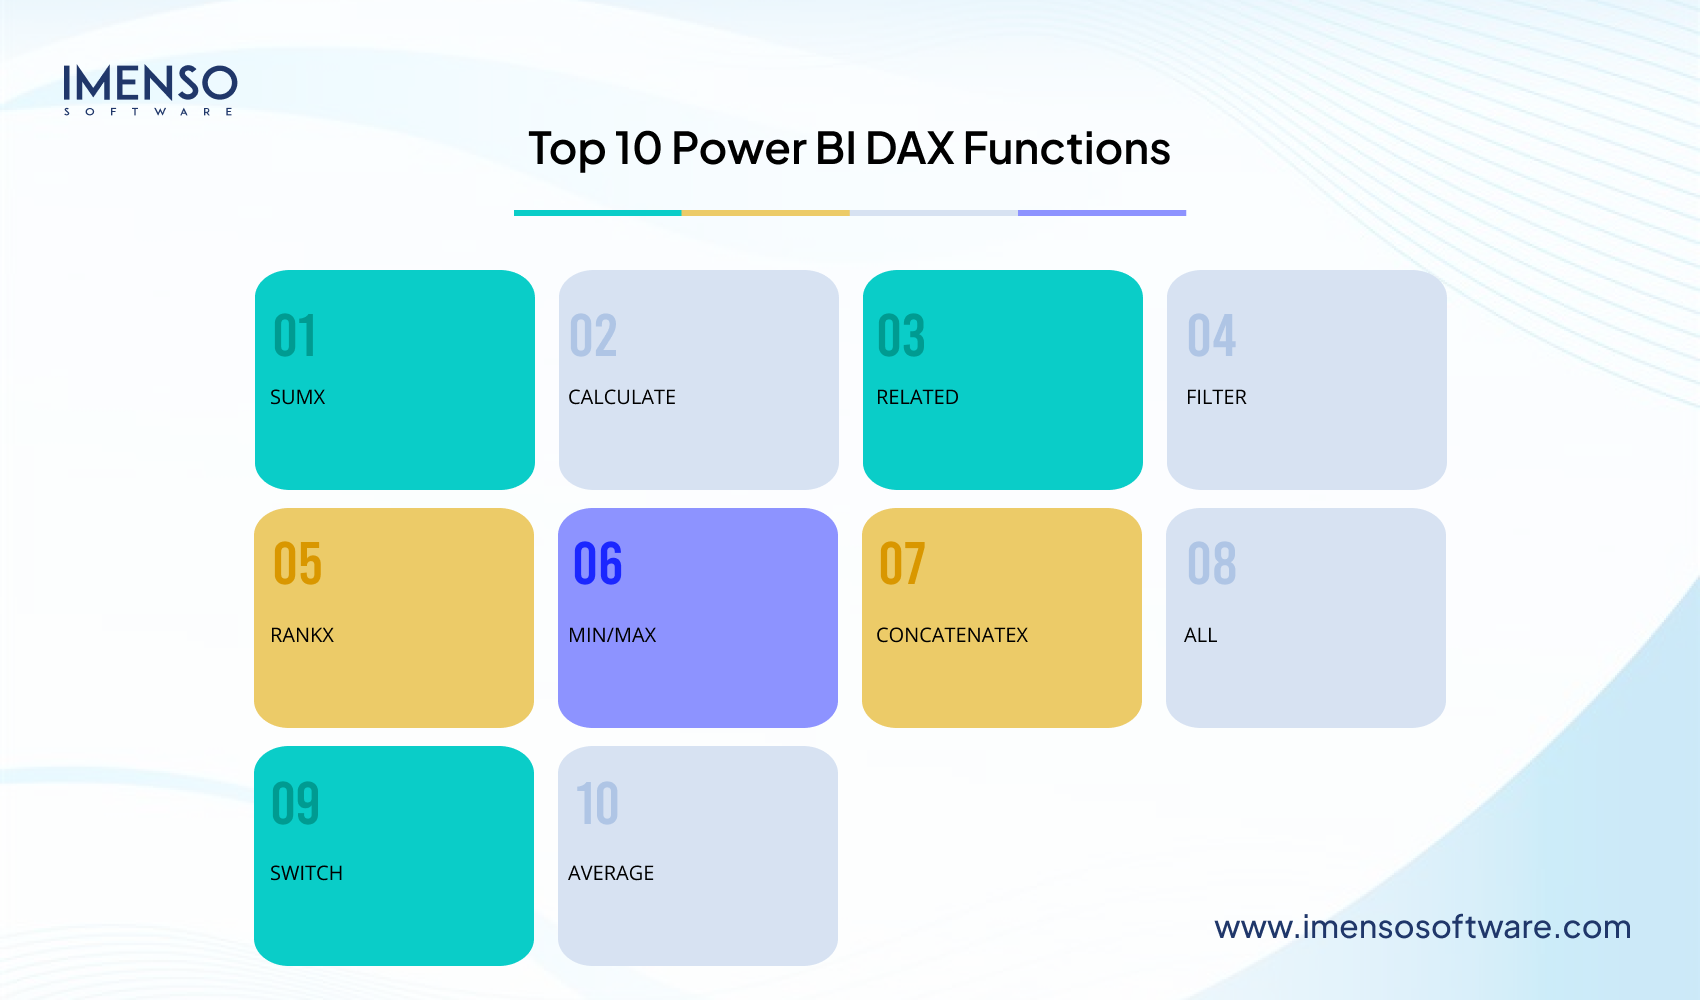
1. SUMX
The SUMX function is a powerful DAX function. It calculates the sum of an expression computed for each row in a table. This function can handle more complex calculations than a simple sum.
Example:
Gross Revenue =
  SUMX(
    Sales,
    Sales[Quantity] * Sales[Price]
)
This measure computes the overall revenue. It does so by multiplying the quantity and price for every row in the Sales table. Then, it sums up the results.
2. CALCULATE
The CALCULATE function lets you modify the filter context for a specific expression. You can use it to create dynamic calculations and apply complex filters. To use CALCULATE(), just add a measure to your table. Go to the Modeling tab in the ribbon and choose New measure.
Example:
Here’s how to use the CALCULATE() function using SUM() to find overall revenue and filtering for Country = United Kingdom.
UK Revenue = CALCULATE(SUM('Online Retail'[Revenue]),
     'Online Retail'[Country] = "United Kingdom")
3. RELATED
This is a DAX Power BI function used to return a linked column from a different table. You can only use RELATED if there’s a relationship between the current table and the one having the related data. If the relationship isn’t there, it needs to be established first. When the column having the relevant data is defined, RELATED links the data. It then fetches the specific column from the linked table.
Example:
Product Category Sales =
SUMX(
  Sales,
  Sales[Quantity] * Sales[Price] *
  RELATED(Products[CategoryMultiplier])
)
This measure computes the total sales for every product category. It does so by using a category-specific multiplier from the related Products table.
4. FILTER
The FILTER table function filters a table. It returns a subset of a table. To use it, you first specify a table name and then a condition. The condition is evaluated row-wise on top of the specified table. Only the rows satisfying the condition are returned as a result. Thus, the FILTER function acts as both an iterator and a table function.
Example:
To understand how FILTER function works, let’s create a new calculated table. The table is filtered to only return products from the ‘Product’ table with a colour of blue.
Blue Products = FILTER (‘Product’, ‘Product'[Colour] = “Blue”)
Here, the FILTER function will evaluate all rows of the ‘Product’ table. For every row, if the ‘Colour’ column has a value of ‘Blue’, this row will be integrated into the new calculated table.
5. RANKX
Next on our list of DAX functions is the RANKX. It calculates the rank of a specific expression in the context of the existing filter. It is ideal to rank data within a table or a visualization. The basic syntax of the RANKX function is: RANKX(<table>, <expression>, [value], [order], [ties])
Note that the RANKX function evaluates the expression in the existing row context. It makes it flexible based on the applied filters in your report.
Example:
Suppose you have a table called ‘Product.’ It has a column named ‘Sales amount.’ You want to compute the rank of each row on the basis of its sales amount. Here’s how to use the RANKX function.
RankColumn = RANKX(‘Product’, ‘Sales’[Sales Amount])
The ‘RankColumn’ will have the rank of each row in the ‘Product’ table. It will be based on the ‘sales amount’ column in ascending order.
6. MIN/MAX
The MIN and MAX DAX functions in Power BI compute the minimum and maximum values in a column of numbers.
a. MIN()
The MIN() function finds the lowest value in any column. Its syntax is as follows:
MIN(Table[Column Name])
To use MIN() function:
Right tap on All Measures in the Fields.
Tap New measure.
Input the following formula in the formula bar and hit Enter
Minimum Unit Price (CM) =
min ( Sale[Unit Price] )
This expression will calculate the minimum value of the unit price in the Unit Price column from the Sales Table.
b. MAX()
The MAX() function returns the maximum value in any column. It has the following syntax:
MAX(Table[Column Name])
To use MAX() function:
Right tap on All Measures in the Fields.
Tap New measure.
Input the following formula in the formula bar and hit Enter
Maximum Unit Price (CM) =
min ( Sale[Unit Price] )
This expression will calculate the highest value of unit price from the Sales Table in the Unit Price column.
7. CONCATENATEX
CONCATENATEX concatenates the results of an expression evaluated for every row in a table. It returns the concatenation in a single string. Concatenation is separated by the specified delimiter.
The syntax is: CONCATENATEX(
    <table> , <expression>, [delimited]
)
CONCATENATEX parameters consists of a table with the rows and the expression to be evaluated for every row. It also includes the delimiter acting as a separator during the concatenation. Further, it has the column by which the values are concatenated, and the order.
Here are a few examples using this DAX Power BI function.
CONCATENATEX(Employees, [FirstName] & “ “ & [LastName], “,”)
CONCATENATEX (Products, [Product],”,”, [Product Key], DESC)
8. ALL
The ALL function modifies the filtering context of data. It facilitates a comprehensive analysis. This happens because it temporarily eliminates filters from a table or column. It enables accurate calculations across the full dataset. Thus, it offers insights that might be hidden by separate filters.
Let’s look at the example below.
Suppose you have a sales dataset with data about various regions and their sales amounts. The dataset has two columns – “Region” and “Sales Amount”. You want to calculate the contribution of each region’s sales to the overall sales. Use the ALL() function to temporarily disregard any filters applied to the “Region” column. Now you can calculate the ratios accurately.
To do so, create a new measure, “Ratio To Total Sale.” It represents the ratio of regional sales to total sales. Use this DAX query:
Ratio To Total Sales = SUMX(RegionSales, RegionSales[Sales Amount])/SUMX(ALL(RegionSales), RegionSales[Sales Amount])
the “Ratio To Total Sales” measure computes the ratio of the sum of sales for every region to the sum of total sales across every region. It removes any filters applied to the “Region” column. So, it ensures that the calculation factors in the overall dataset’s sales amount.
9. SWITCH
The Switch DAX Power BI function reviews your data. It checks certain rules you set. Then, it categorizes the data based on those rules. The function is useful to keep data organized.
Example: Sales Region Categorization
Suppose you have a sales dataset. You have to categorize each sale into a region according to the sales amount. Here’s how to use the Switch function:
Region = SWITCH(
  TRUE(),
  Sales[SalesAmount] >= 100000, “North”,
  Sales[SalesAmount] >= 50000, “South”,
  Sales[SalesAmount] >= 10000, “East”,
  “West”
)
In this example, sales more than $100,000 are categorized as ‘North.’ Those between $50,000 and $99,999 are labeled as ‘South’, and so on. This simplifies categorization. It also adds dynamic layers to your data analysis.
10. AVERAGE
The AVERAGE function is a DAX Power BI function that computes the average value of a column in a table. It lets you calculate the average of a set of values quickly.
Example:
Suppose you have the following table.
Region | Sales |
  East   | 500   |
  West   | 600   |
  East   | 700   |
  South  | 900   |
  North  | 800   |
  South  | 1000  |
You can use the AVERAGE function to compute the average sales for all salespeople in this table. To do so, use the AVERAGE function like this:
Average Sales = AVERAGE(Sales[Sales])
Importance of DAX for Power BI
To create a basic report with data, you must know how to use Power BI Desktop. But if your report demands complex calculations, DAX becomes critical.
Suppose you want a visual to assess growth percentage across various states. In this case, the data fields you import into a table aren’t enough. You cannot analyse the growth percentage with it.
Here comes the power of DAX as it lets you create new measures. You can use them to create unique visualizations. Thus, it gives you insights into your data. This, in turn, arms you with the best solutions to business problems. It wouldn’t have been possible had you not used DAX. DAX is thus critical for an intelligent data analysis in Power BI.
Another case where DAX formulas prove useful is when you want to reuse a formula. Suppose you want to use a formula in various charts. Here, using DAX will make your report more effective. It will be easier for you to change it in the future as well. This is because you would only need to change one formula instead of many separate ones wherever they are used.
- What are the top 10 DAX functions in Power BI?
The top ten DAX functions in Power BI are CALCULATE (to filter context for an expression), SUMX (to do custom calculations on every row), FILTER (to make a new table based on particular conditions), RELATED (to get values from related tables), DATEADD (to shift dates forward or backward in time and compare), SWITCH (to analyze a given expression against specific cases and get the result for the first case that matches), CROSSFILTER (to do bi-directional filtering), RANKXX (to rank items according to a given expression), IF (to check a condition and return the value if it’s true), and TREATAS (to apply dynamic filtering).
- How many DAX functions are in Power BI?
There are more than 250 Data Analysis Expressions (DAX) functions in Power BI that allow you to perform complex calculations. These calculations for business intelligence are beyond the scope of traditional Excel-based formulas.
- How does Power BI DAX Differs from Excel Functions?
Excel functions work with individual cells and ranges. In contrast, DAX works with tables and their columns. DAX formulas and functions help you gain company-wide insights as they are applicable to huge quantities of data. Excel functions only allow you to perform quick calculations and compare small amounts of data.
- What are filters in Power BI?
Filters allow you to refine information according to specific conditions in Power BI. Some common filters are visual-level filters, page-level filters, and report-level filters.
Concluding Words
The DAX language in Power BI is great for analyzing current data. It’s also used to create new ones for enterprise-level data analysis. The broad range of functions is useful to precisely analyze vast amounts of any type of data. Thus, you can create reports and visualizations for your company’s growth.
Want more information about our services?


Similar Posts
Data Cleaning in Power BI: Tips for Getting the Most Accurate Visuals
“Without clean data, or clean enough data, your data science is worthless.” – Michael Stonebraker, adjunct professor, MIT. Imagine steering a ship with a damaged compass. It wouldn’t let you reach your desired destination. This is what it’s like to make decisions based on unclean data. It leads to misguided steps, financial losses, and missed […]...

Data Visualization: Not Data, Decisions Should Drive Business Goals
Believe it or not, this is the age of data visualization. Analysts and Power BI consultants now have a unique approach to data. In today’s age of big data, data analysis is a must-have and makes great sense in the business world....

Enhancing Professional Data Modeling with Power BI Data Analytics
In the field of business intelligence, Power BI stands out due to its extensive data modeling capabilities. These capabilities are crucial for extracting useful insights from intricate datasets. This procedure includes setting up tables and columns, creating relationships, putting role-playing elements into practice, and more. Furthermore, Power BI offers strong security features including row-level security […]...


