Enhancing Professional Data Modeling with Power BI Data Analytics
In the field of business intelligence, Power BI stands out due to its extensive data modeling capabilities. These capabilities are crucial for extracting useful insights from intricate datasets. This procedure includes setting up tables and columns, creating relationships, putting role-playing elements into practice, and more. Furthermore, Power BI offers strong security features including row-level security and powerful data manipulation using Data Analysis Expressions (DAX).
This article explores these important areas and provides the importance of effective data modeling with Power BI data analytics, offering insights that every Power BI Expert can leverage to enhance their data-driven strategies.
What is Data Modeling?
Data modeling is the procedure of developing a visual description of a system’s data components and their connections. In the context of business intelligence: Organize data into tables. Define relationships between them. Generate meaningful insights. A well-structured data model simplifies complex datasets. This makes data analysis more accurate. Faster query performance is also achieved. Easier reporting is another benefit.
Data modeling typically involves three stages:
- Conceptual Modeling: This is the high-level design. Here, you define entities such as customers, products, or transactions. You define how these entities relate to each other.
- Logical Modeling: In this place, you define the data structures. You specify the tables, columns, and relationships between different tables.
- Physical Modeling: The final step has two parts: Implementing the data structures on a database platform. Ensuring efficient performance and handling of real-world data workloads.
Power BI is effective in creating both logical and physical data models. It helps users extract actionable insights with minimal effort.
Why Power BI for Data Modeling?
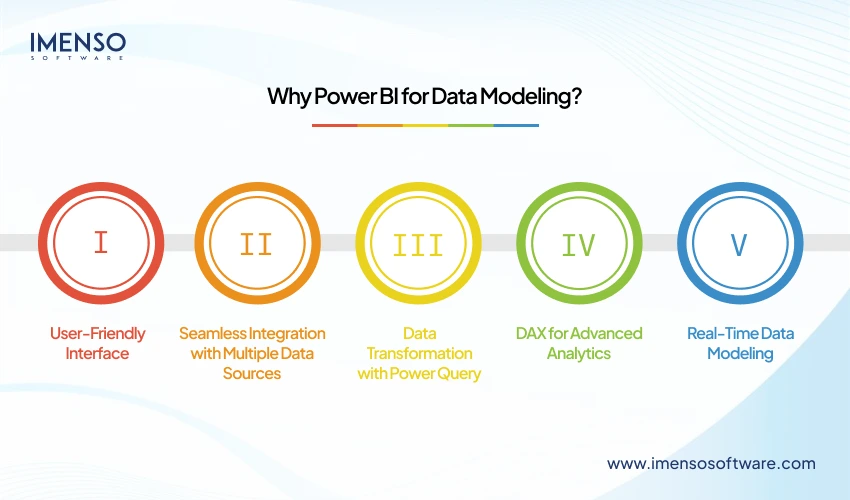
Power BI is a business analytics software program advanced by Microsoft. It gives an extensive variety of qualities for data visualization, reporting, and modeling. Its ability to combine different data sources makes it an excellent choice. It creates cohesive models, making it an excellent choice for Power BI dashboard experts’ data modeling. Here are several reasons why Power BI is the preferred tool for data modeling:
1. User-Friendly Interface
Power BI’s instinctive drag-and-drop interface makes it useful for both technical and non-technical customers. It allows users to create relationships between datasets, enables users to visualize data with ease and It provides the ability to perform data transformations without writing extensive code. Power BI dashboard experts make it easier to understand complex data relationships with its visual representation of data models. This visual representation helps manage complex data relationships in Power BI.
2. Seamless Integration with Multiple Data Sources
One of Power BI’s robust characteristics is its possibility to combine with different data origins. For example, Power BI can hook up with Excel, SQL Server, Azure, Google Analytics, and Salesforce. Users can connect disparate data assets right into a single model. This allows them to work with the data without having to switch between multiple platforms. By centralizing data from various sources, businesses can collect comprehensive data. This collected data allows businesses to create models that provide a holistic view of their operations.
3. Data Transformation with Power Query
Power BI’s Power Query trait allows users to transform, clean, and shape data before it is loaded into the model. Users can filter rows using an intuitive interface. They also can eliminate duplicates, change data types, and perform different data variations. This removes the need for complicated SQL queries and makes the process of making ready data for modeling less difficult.
4. DAX for Advanced Analytics
Power BI’s Data Analysis Expressions (DAX) language enables customers to carry out complicated calculations. Users can also carry out aggregations with the use of Power BI’s Data Analysis Expressions (DAX) language. DAX is essential for creating custom metrics and measures that go beyond basic summarizations. With DAX, users can calculate year-over-year growth. They can also calculate moving averages and other advanced KPIs. This enhances the depth and accuracy of the data model. These calculated fields add significant value to business insights. They enable more nuanced analysis.
5. Real-Time Data Modeling
With Power BI, businesses can build dynamic data models. These models update automatically with the newest information due to Power BI’s immediate analytics capabilities. This is useful for industries like retail, funding, and logistics. In these sectors, real-time decision-making is essential. Power BI monitors live sales data. It also tracks key overall performance indicators (KPIs). Users usually work with the most up-to-date facts in Power BI.
Power BI’s Visual Interaction characteristic allows users to click on a particular information point to look at the way it affects other visualizations. This interactivity allows for exploring relationships in the data and uncovering hidden styles.
Also Read:
Discover How to Become a Power BI Developer in an Easy Step Guide
How To Become A Power BI Application Developer?
How Power BI Professional Services Can Transform Your Business Operations
Best Practices for Data Modeling in Power BI
To assemble the most of Power BI’s data modeling techniques, it’s necessary to pursue high-quality practices. Here are a few recommendations to keep in thoughts:
- Use Star Schema: Organize your data in a star schema to optimize performance. This entails having dimension tables encircling a center fact table. The dimension tables make querying faster and more efficient.
- Define Clear Relationships: Clearly define the relationships between your tables. Use primary and foreign keys to define the relationships. This ensures that your model generates accurate insights.
- Leverage DAX Measures: Use DAX to create custom measures that provide deeper insights. Instead of relying on basic summarizations, build KPIs and metrics that align with your business goals.
- Optimize Data Load: Power BI’s data models work best when unnecessary columns and rows are removed. Clean and filter your data before loading it into the model to improve performance.
- Monitor Model Size: Keep an eye on the size of your data model, as large models can slow down performance. Use Power BI’s data compression features to manage model size efficiently.
Conclusion
Power BI is a robust tool that improves professional data modeling. It offers a user-friendly interface, provides advanced analytics and ensures seamless integration with multiple data sources. These features significantly enhance the process. By the use of Power BI’s data modeling capabilities, businesses can streamline their statistics analysis methods. This allows them to generate actionable insights and make data-driven choices with self-belief. If you are a statistics expert or a commercial enterprise analyst, adopting a Power BI expert will assist you release the whole capability of your data.
We’re honored to mention that our efforts have been recognized by renowned B2B review and research platforms such as GoodFirms, Clutch, MirrorView, and many more.
Want more information about our services?


Similar Posts

Transform Your Business Operations with Microsoft Power BI
Back in the 1970s, companies had to handle a lot of paperwork for every department. But with the invention of the computer, now in 2021, everything is digital. Because of the revolutionizing technology of computers, there is minimal paperwork and hard copies of business records....

How Microsoft Business Intelligence Consultants Drive Success
When the time passes every business is moving towards hiring an expert culture. But stop, do you know there are still many small businesses that come with this question? What’s that…The question is do we need a consultant? So the answer is yes! It’s true nowadays every business needs a professional who can skyrocket your […]...

8 Mistakes Businesses Make When Adopting Power BI and How to Avoid Them?
Numbers have an important story to tell. They rely on you to give them a voice. ~ Stephen Few Did you know, data is ultimately an organizational asset? You can transform it into information that facilitates actionable-insights for your organization. Microsoft Power BI does just that. You can connect disparate data sets, transform, and clean […]...


