Power BI vs Tableau: Which Data Visualization Tool Should You Choose?
Power BI and Tableau are popular data analytics tools. However, they share many features. For businesses thinking about trying them out, it’s important to be clear about what each tool excels at. Any confusion here and you are bound to make a wrong decision.
This blog will give you all the clarity you need.
Quick Answer: Power BI or Tableau?
Go with Power BI if:
- You have a tight budget
- Use other products by Microsoft
- Need a quick, easy setup
- Want ease of use
Choose Tableau if
- You require complex visualizations
- Work with large datasets
- Require deep customization\
- Have a higher budget
What This Comparison Will Help You Decide
Picking the best tool comes around to one thing. It is your needs. In other words, what you intend to do with the tool. The right tool for you is the one that suits your needs. Below, we have provided the best tool choice for different needs.
Choosing a tool for learning
If you are just starting, your focus should be on ease of learning.
Here is what you should consider:
- Power BI is easier to learn because it feels similar to Excel
- Tableau is hard to learn. However, it gives you more control.
- Power BI has many tutorials for novices. Besides, it also has massive developer community support.
So, if you want a job in data analytics fast, Power BI is a good choice.
Choosing for your job or business
If you are selecting a tool for work, think about your daily needs.
Here are some practical points:
- Power BI is great for regular reporting and dashboards
- Tableau is better for deep data exploration and complex analysis
- Power BI works well for teams using Microsoft systems
- Tableau is useful when teams need flexible data connections
Choosing based on budget or scale
Cost and data size matter more than most people think.
Here is how to decide:
- Power BI is cost-effective and works well for small to mid-sized teams
- Tableau is more expensive but handles large datasets better
- Power BI is ideal if you want quick ROI
- Tableau is better if your business depends heavily on data analysis
What Is Power BI?
Power BI is basically a business intelligence platform. It’s a tool that experts use to visualize data to extract insights. Power BI helps understand raw data in one effective way. It turns it into dashboards and reports.
The tool can be linked to diverse data points. It cleans, asses and visualizes data in a single place.
Due to these abilities, analysts use Power BI for reporting. These reports inform their decision-making.
Key strengths
Here are the main strengths of Power BI:
- It is easy to learn for beginners
- It works smoothly with Excel and other Microsoft tools
- It offers strong data modeling using DAX
- It is affordable compared to other tools
- It allows quick dashboard creation
Best for
Power BI works best in these situations:
- When your team already uses Microsoft tools like Excel or Azure
- When you need fast and simple dashboards
- When your data is structured and not extremely large
- When you want a cost-effective solution
- When business users need to create reports without heavy technical skills
What Is Tableau?
Tableau is a tool for visual data analytics. Salesforce owns this software. It deeply assesses data. Then, it displays insights. These are accompanied with clear visuals.
Basically, Tableau lets you dig into data visually. Analysts use it to create immersive dashboards. The platform lets them identify insights quickly.
Key strengths
Here are the main strengths of Tableau:
- It offers advanced and interactive visualizations
- It handles large datasets efficiently
- It supports deep data exploration
- It allows flexible data connections
- It provides strong storytelling features
Best for
Tableau works best in the following cases:
- When you need detailed and complex analysis
- When your datasets are large and varied
- When visual storytelling is important
- When analysts need more control over data
- When your organization relies heavily on data insights
Power BI vs Tableau: Key Differences at a Glance
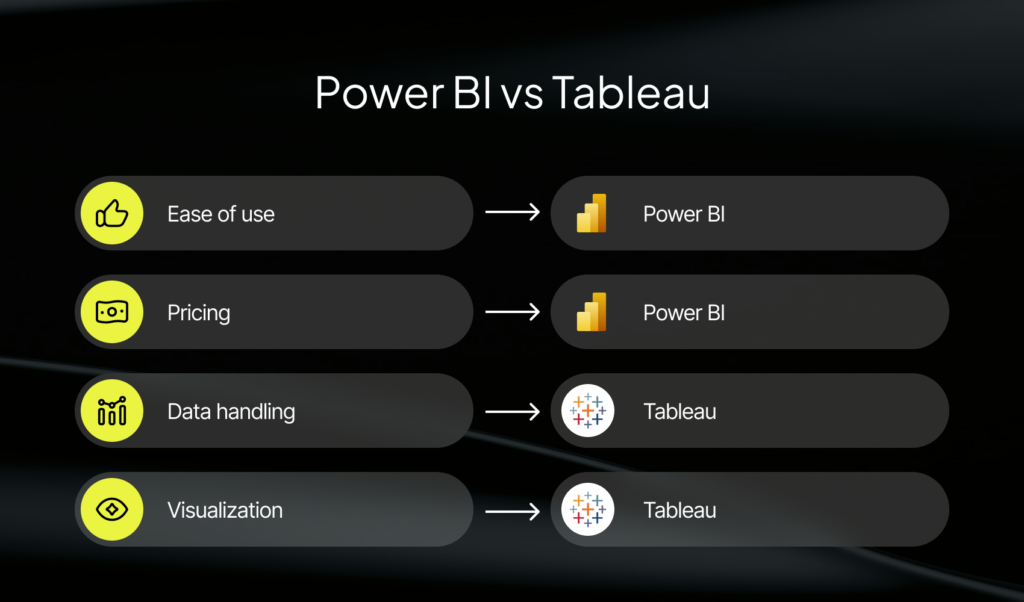
Both tools are strong business intelligence and data visualization tools. But they serve slightly different needs.
| Feature | Power BI | Tableau |
| Ease of use | Easy for beginners and business users | Moderate learning curve, better for analysts |
| Pricing | Affordable and budget-friendly | Higher cost, especially for teams |
| Data handling | Best for small to medium datasets | Handles large and complex datasets well |
| Visualization | Good standard visuals | Advanced and highly interactive visuals |
| Integration | Strong with Microsoft ecosystem | Supports many external data sources |
Pricing Comparison
Pricing is one of the biggest factors in the Power BI vs Tableau decision. This section gives you a simple and accurate breakdown.
Simple breakdown
Here is the basic idea you should understand first:
- Power BI offers lower pricing and flexible plans
- Tableau has higher pricing but more advanced capabilities
- Power BI is easier to adopt for small teams
- Tableau is designed more for large-scale analytics environments
Monthly cost ranges
Below is a clear comparison based on official pricing pages.
| Plan type | Power BI | Tableau |
| Free version | Available with limited features | Available as Tableau Public (very limited) |
| Entry-level paid plan | Around $10 per user/month (Power BI Pro) | Around $75 per user/month (Tableau Creator) |
| Mid-tier plan | Around $20 per user/month (Power BI Premium Per User) | Around $42 per user/month (Explorer) |
| Enterprise plan | Starts around $20 per user/month or capacity-based pricing | Around $15 per user/month (Viewer, limited access) |
Simplifying pricing for different users
Let us simplify what this pricing means for different users.
For individuals and small teams
- Power BI is much more affordable
- You can start with a low monthly cost
- It gives strong value for basic reporting needs
For growing businesses
- Power BI still remains cost-effective as you scale
- Tableau starts becoming expensive as more users are added
For large enterprises
- Tableau offers advanced features that justify the cost
- It is often used where deep analytics is critical
- Power BI can still work well with the right setup and power BI experts
Best for budget users
If your budget is limited, Power BI is the better choice because it offers:
- Lower entry cost
- Free version available
- Strong features for the price
- Easy to scale without high costs
Best for enterprise teams
If your organization needs advanced analytics, Tableau is the best option. It has:
- Powerful data visualization capabilities
- Better handling of large and complex datasets
- More flexibility for data exploration
- Widely used in data-driven enterprises
Ease of Use: Which Tool Is Easier?
Ultimately, you’ll use the tool to help you with better data analytics. But if it isn’t easy to use, you can’t create effective reports. Here’s how both fare when it comes to this aspect.
Power BI: Beginner-friendly
Power BI is designed for business users and beginners. Its interface is intuitive and similar to Excel. The tool lets power BI experts create advanced dashboards. But even non-technical users can make reports without deep training.
Here are some important points to note regarding the tool’s ease of use.
- Learning time:Short, often a few days for basic dashboards
- UI experience: Clean and simple. Power BI is easy to navigate
- Setup effort: Minimal, especially if you already use Microsoft tools
Tableau: Steeper learning curve
Tableau is more advanced. It provides flexibility but requires more time to master. The tool shines when your team needs deeper data exploration. However, it demands more initial effort than Power BI.
Here’s what you need to know.
- Learning time: Moderate to long. It may take weeks to become proficient
- UI experience: Flexible. Tableau is designed for analysts, but can feel complex for beginners
- Setup effort: Requires configuration for data connections and advanced dashboards
Comparison table: ease of use
| Feature | Power BI | Tableau |
| Learning time | short, beginner-friendly | moderate to long, analyst-focused |
| UI experience | simple, intuitive | flexible but complex |
| Setup effort | minimal | moderate, some configuration required |
Compare your data needs and find the right BI approach.
Data Visualization: Which One Looks Better?
Visual data analytics is a strong feature of both software. But the depth of this feature differs.
Tableau: More advanced visuals
Tableau offers immersive visuals for data analytics. That’s why it’s used to showcase layered, complex data. It presents this nuanced information in a clear way.Tableau is ideal when data storytelling is important and users need deep insights.
It offers:
- Chart flexibility: Tableau supports a wide variety of charts and graph types
- Custom visuals: Highly customizable to match specific needs
- Dashboard design: Allows interactive dashboards with filters and actions
Power BI: Good but simpler
Power BI provides standard visualizations that cover most business reporting needs. It is simpler but still effective for clear insights. The tool is suitable for easy-to-read dashboards. It is also Power BI works best when dashboards are straightforward and speed is more important than design complexity.
The tool offers:
- Chart flexibility: Covers basic charts like bar, line, pie, and combo charts
- Custom visuals: Available through marketplace, limited compared to Tableau
- Dashboard design: Clean and easy to share. It is less complex than Tableau
Side-by-side visual comparison
| Feature | Power BI | Tableau |
| Chart flexibility | basic to moderate | advanced and interactive |
| Custom visuals | marketplace options | highly customizable |
| Dashboard design | clean and simple | interactive and detailed |
Handling Large Data: Performance Comparison
When comparing Power BI vs Tableau, performance with large datasets is critical. How quickly a tool processes data affects decision-making.
Tableau: Better for large & complex datasets
Tableau is built to handle big and complex datasets efficiently. Analysts often use it for deep insights across multiple data sources.
Tableau is ideal for enterprises that need advanced analytics across complex data environments. This is because:
- Speed: Processes large datasets smoothly
- Scalability: Can handle growing volumes of data without slowing down
- Real-time data: Supports live connections for up-to-date insights
Power BI: Strong but depends on model
Power BI performs well with small to medium datasets. Its performance depends on how data models are structured. Power BI experts can optimize models to improve performance for larger datasets. Still it may not match Tableau for very heavy analytics.
This is because:
- Speed: Fast for structured and moderate-sized datasets
- Scalability: May slow if datasets are very large or poorly modeled
- Real-time data: Supports streaming datasets, but performance varies by data source
Comparison table: large data performance
| Feature | Power BI | Tableau |
| Speed | fast for small/medium data | fast for large and complex data |
| Scalability | moderate, depends on model | high, handles large volumes well |
| Real-time data | supported, performance varies | supported, optimized for live connections |
Integration & Ecosystem
Integration is essential when using business intelligence and data visualization tools. How a tool connects with other software affects workflow efficiency.
Power BI: Best with Microsoft tools
Power BI works seamlessly with the Microsoft ecosystem. It connects easily to Excel, Teams, SharePoint, and Azure.
Here’s what you should know regarding Power BI’s integrations.
- Third-party integrations: Supports many popular apps but strongest with Microsoft tools
- Data connectors: Direct connections to SQL Server, Excel, Azure, and cloud databases
- Ecosystem advantage: Easy collaboration for teams already using Microsoft products
Tableau: Strong with cloud and Salesforce ecosystem
Tableau integrates well with cloud platforms and Salesforce. It supports many data sources and third-party apps.
Tableau allows advanced analytics across diverse systems, making it suitable for complex enterprise workflows. The points below will make this clearer.
- Third-party integrations: Wide variety, including databases, CRM systems, and cloud platforms
- Data connectors: Connects to SQL, Oracle, AWS, Google Cloud, and more
- Ecosystem advantage: Ideal for organizations using Salesforce or multi-cloud environments
Comparison table: integration & ecosystem
| Feature | Power BI | Tableau |
| Best ecosystem | Microsoft tools | Salesforce and cloud platforms |
| Third-party integrations | moderate, mostly Microsoft-aligned | extensive across databases and cloud apps |
| Data connectors | SQL Server, Excel, Azure, cloud | SQL, Oracle, AWS, Google Cloud, others |
Key insight
According to Deloitte, organizations that use tools aligned with their existing ecosystems see faster adoption and better collaboration. This shows why Power BI is ideal for Microsoft-heavy environments, while Tableau fits complex or cloud-based ecosystems.
AI & Advanced Features (2026 Edition)
Business intelligence and data visualization tools are evolving quickly. In 2026, both Power BI vs Tableau now include AI and advanced features to make analysis faster and smarter.
Power BI: Copilot + Fabric ecosystem
Power BI has integrated AI features through Microsoft Copilot and the Fabric ecosystem. These tools help users automate insights and simplify data workflows.
- Copilot: Generates natural language summaries and suggestions for dashboards
- Fabric ecosystem: Integrates data engineering, lakehouse, and analytics in one environment
- Predictive insights: AI helps forecast trends and highlight anomalies automatically
- Automation: Tasks like data cleaning and report generation can be partially automated
Power BI experts can use these features to accelerate reporting and create intelligent dashboards with minimal effort.
Tableau: AI features like predictive insights & automation
Tableau also leverages AI for smarter analytics. Its AI capabilities help analysts discover trends and automate routine processes.
- Predictive insights: Uses AI to forecast trends and detect patterns
- Natural language queries: Users can ask questions in plain language and get answers
- Automated alerts and recommendations: Tableau can notify teams about unusual data trends
- Integration with Salesforce Einstein: Brings AI-driven insights into dashboards
Tableau is ideal when organizations need AI-enhanced analytics for large or complex datasets.
Real-World Use Cases
Choosing the right tool depends on the type of user and the business need. Here is a practical guide for different teams and scenarios.
Small business: Power BI
- Quick to set up and learn
- Affordable for small teams
- Provides clear dashboards for sales, inventory, and basic reporting
Enterprise analytics: Tableau
- Handles large, complex datasets
- Supports multiple departments and deep analysis
- Ideal for strategic decision-making and enterprise-level dashboards
Marketing dashboards: both
- Both Power BI and Tableau can visualize campaign data
- Track metrics like leads, conversions, and ROI
- Choose based on team skill and ecosystem preference
Finance teams: Power BI
- Integrates well with Excel and ERP systems
- Supports quick financial reporting and forecasting
- Low-cost solution for budgeting and analysis
Data science teams: Tableau
- Supports complex data modeling and advanced visualization
- Connects to cloud platforms, Python, R, and other tools
- Ideal for predictive analytics and machine learning dashboards
Power BI is strong for small businesses, finance, and teams needing quick, cost-effective dashboards. Tableau excels for enterprise analytics, data science, and complex reporting.
Choosing the right tool depends on your team, data complexity, and whether AI-enhanced insights are a priority.
When NOT to Use Each Tool
Knowing when Power BI vs Tableau is not the right choice is just as important as knowing their strengths. Using the wrong tool can waste time and money. Here’s how to avoid mistakes.
When Power BI is not a good choice
Power BI works best for small to medium datasets and teams using Microsoft tools. It is not ideal in certain situations.
You should avoid Power BI if:
- Your datasets are extremely large and complex, which may slow performance
- You need highly advanced, interactive visualizations for storytelling
- Your organization relies heavily on multi-cloud or non-Microsoft data sources
- AI-driven predictive analytics and automation are critical at scale
- You need deep customizations that go beyond available Power BI visuals
Even though power BI experts can optimize models, there are limits when data or visualization complexity exceeds its design.
When Tableau is not a good choice
Tableau excels at complex analytics and enterprise reporting, but it is not perfect for every user.
Avoid Tableau if:
- Your team is new to business intelligence tools and needs a fast learning curve
- Budget is tight, as Tableau’s licensing is expensive for multiple users
- You need simple dashboards for routine reporting without advanced features
- Microsoft ecosystem integration is crucial for your workflow
- Small teams require quick adoption without training
Tableau is best when your team has analyst skills and your organization can invest in training and licensing.
Key takeaway
- Power BI is not ideal for extremely complex data or advanced visual storytelling.
- Tableau is not ideal for beginners, small budgets, or simple dashboards.
Using the right tool for the right scenario saves time, reduces errors, and ensures better decision-making.
Power BI vs Tableau: Final Verdict
Follow this logic to pick the right tool:
- If you want affordability: Power BI
- If you want advanced analytics: Tableau
- If you are a beginner: Power BI
- If you are a data expert: Tableau
Turn your data into smarter, actionable decisions.


Similar Posts

Power BI Embedded vs Power BI Service: Which Is Right for Your Application?
Key Takeaways Power BI Service vs Embedded: Feature Comparison Factor Power BI Service Power BI Embedded Best for Internal dashboards Analytics inside apps Users Employees, internal teams Customers, external users Access Power BI web portal Inside your application Setup effort Low Medium to high Developer involvement Minimal Required Embedding Limited (iframe) Full embedding via APIs […]...

Business Intelligence in the Financial Industry: Unlocking Insight
The business world becomes more competitive every day. The only way to cement your position is through data-led decisions. In this context, Business Intelligence (BI) has risen in importance. It’s a set of processes, tools, and technologies that convert raw data into precious findings. Using the newly acquired learnings, financial professionals can make well-founded decisions. […]...