Choosing Between Power BI and Excel for Modern Reporting: A Strategic Guide

The world of finance is fast-paced. Creating reports and statements before the official closure is often a challenge. The old methods demand many iterations. This only increases delays and the risk of errors.
Luckily, technology has come to our rescue. Tools like Power BI and Excel help you upgrade your reporting capabilities. By offering accurate financial data analysis, they enable you to make sound decisions.
Microsoft Excel is a familiar name for many startups. But is it the best reporting tool out there? Power BI is more of a newcomer in this field. The business intelligence tool has powerful features for reporting and data analysis. But again, the question of whether it’s the right choice for you arises.
Let’s understand both in detail so you can arrive at the answer yourself.
The Need for Modern Reporting Tools
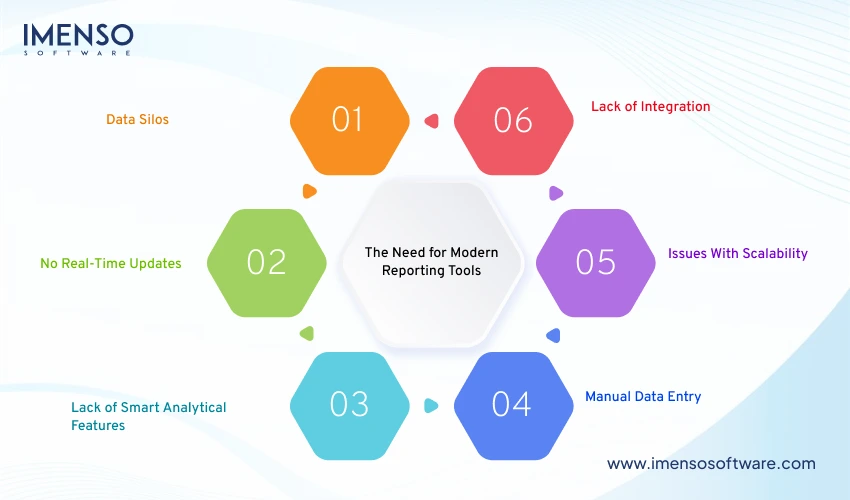
Startups across sectors find project reporting to be a cumbersome process. Most of them are stuck on manual ways of tracking. This makes them face the following issues:
Data Silos
Data silos occur when data is stored in separate devices. It prevents one from getting a holistic view of the project’s status.
No Real-Time Updates
Basic tools lack real-time data updates. This leads to obsolete data. It delays effective decision-making.
Lack of Smart Analytical Features
Manual ways of tracking lack modern analytics and visualization features. It makes it tough to get insights from data.
Manual Data Entry
Using manual data entry increases the error rate. It takes up the time that would otherwise be spent on purposeful tasks.
Issues With Scalability
When projects turn complex, basic tools struggle to scale. This causes project inefficiencies and delays.
Lack of Integration
Many tools cannot integrate with other critical systems. This leads to scattered and inefficient processes.
Also Read: 10 Compelling Reasons to Switch from Excel to Power BI for Data Analytics
What is Power BI?
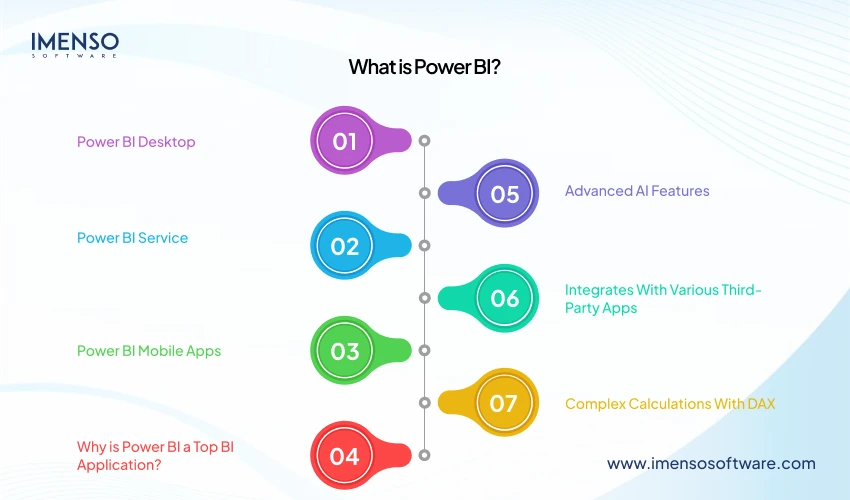
Power BI is a business intelligence tool. Its main job is to help you discover insights from data. These insights help you enhance your decision-making.
Power BI has three main products. These are:
Power BI Desktop
It’s a desktop app to build and design reports.
Power BI Service
This is an online publishing service. You use it to view and share reports.
Power BI Mobile Apps
Power BI mobile apps let you view reports wherever you are.
Why is Power BI a Top BI Application?
Several features make Power BI a leading BI tool.
Advanced AI Features
Power BI has robust AI features, such as time-series analysis, clustering, and NLP. All of these are part of its Q&A feature.
Integrates With Various Third-Party Apps
Power BI directly integrates with various third-party apps. You can also build custom links.
Complex Calculations With DAX
Power BI goes a step above the DAX formulas in Excel. It supports more advanced computations.
Must Read: How Power BI is Transforming Business Intelligence
What is Excel?
Excel is a spreadsheet software. Like Power BI, a common use of Excel is for reporting. The tool organizes and assesses small and large data. It has various formulas and functions for this purpose.
Teams across a startup use Excel. You can find it being used in operations management, HR, and reporting.
Why Is Excel a Top Tool for Data Analysis?
Excel features make it one of the best tools for data analysis.
Presence of Many Predefined Functions
Excel has various functions and formulas. You can also merge several functions for custom calculations.
Data Visualization
You can visually present your data in Excel. This makes it easy to analyze data. It further expedites the creation of reports.
Readily Available Templates
Microsoft offers readily available Excel templates. You can also share your own templates with others. Alternatively, use templates made by others for your data analysis.
Power Query for Data Transformation
The Power Query tool is present within Excel. It lets you load data from various sources. You can perform complex data transformations. Then, import the data into your workbook.
Assessing Power BI for Financial Reporting
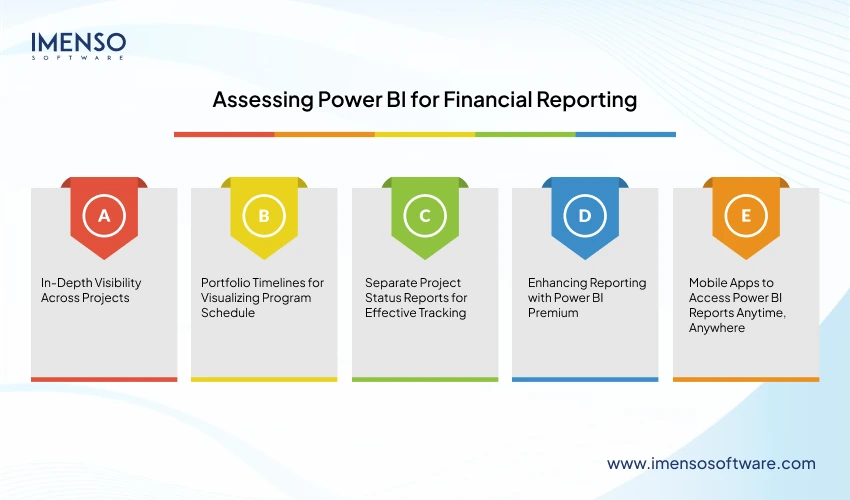
Power BI has made its name as a brilliant data visualization tool. It can entirely transform your reporting process. The tool lets you quickly create interactive dashboards. These offer real-time insights into your progress. You can easily spot patterns in your data. This helps you with strategic decision-making.
Below are the major ways in which Power BI helps with modern reporting.
In-Depth Visibility Across Projects
Using Power BI with a project portfolio solution lets you create portfolio dashboards. These offer deep visibility across portfolios. The senior staff can use them to view various portfolios at once.
You can merge all project data and metrics in one dashboard. It gives you accurate insight into your project’s progress. There are various filter options. You can filter by team, status, or project type. Thus, you can create customized dashboards.
Portfolio Timelines for Visualizing Program Schedule
The ‘Portfolio Timeline’ is a Gantt chart. It shows active projects across a definite period. Senior managers can visualize projects in a business plan spanning any number of years. This lets them assign people and resources to new projects timely.
You can filter projects by project manager and date. Reports like Issue Report and Report Dashboard let you dig deeper into each project.
Separate Project Status Reports for Effective Tracking
A project status report in Power BI lets you get all project details for a specific time. In Power BI, you have separate status reports for each project. This simplifies tracking progress.
Using Power BI with project portfolio software, you can filter and view data in various ways. These include filtering by project name, health, time, or issue status.
Project managers can use the project status dashboard to gain a deeper view of each project. They can check the status of issues, risks, and tasks.
Enhancing Reporting with Power BI Premium
Power BI Premium comes with even better capabilities. Below are the key ways in which it enhances reporting.
- Power BI Premium has dedicated cloud compute and storage resources. They excel in report generation. These resources can handle huge datasets.
- AI and ML tools enable predictive analytics. This improves forecasting.
- Power BI Premium supports large data models. It can also integrate various sources like ERP and CRP. Thus, it gives a unified view of project metrics.
- Paginated reports and sharing options lead to better collaboration.
- Scheduled reports help keep project managers updated with the latest data.
Mobile Apps to Access Power BI Reports Anytime, Anywhere
Power BI mobile apps let you access reports on the go. They give you real-time access to project data and reports. It leads to better and quicker decision-making. Managers can use the apps to stay connected with team members when not in the office.
Mobile apps have features to share reports from the app. Push notifications update you on critical things so you can intervene timely. You can also access earlier reports even when offline.
Key Components of Power BI Reporting
With Power BI, you can link to various data sources. It cleans messy information and creates easy-to-grasp reports. Below are the key elements that lead to efficient reporting.
Power BI Desktop: A Tool for Report Building and Data Modeling
Power BI Desktop is a free app to create reports. It lets you connect to data, transform it, and develop visualizations. Power BI Desktop supports drag-and-drop features. This simplifies report design. You can create data models for deeper analysis. Then, publish reports to the Power BI service.
Power Query: Data Conversion and Cleaning
Power Query cleans and prepares data before assessment. You can eliminate errors and filter rows. The user-friendly interface lets you shape data without coding. Power Query automates data cleaning. Thus, it saves you time.
Power Pivot: Complex Data Modeling and Calculations
Power Pivot creates advanced data models. It also creates relationships between tables. Power Pivot uses DAX for complex calculations. You can build measures for in-depth insights. Power Pivot can handle large datasets efficiently. The tool is best suited for financial analysis.
Power View: Engaging Data Visualizations
Power View creates interactive charts and tables. It lets you filter and dig deeper into data. The tool supports various visual formats. These include maps, and bar charts, among others. Reports update dynamically as you interact with them. It simplifies data exploration.
Power Map: Location-Based Insights
Power Map displays data on 3D maps. It plots data points on a custom map. You can create tours to display trends over a period. The tool is suited for sales reports. Location-based data visualization enhances decision-making.
Power BI Service: Cloud-Based Sharing and Collaboration
The Power BI service hosts reports in the cloud. It makes way for easy and quick access to them. You can share dashboards with your teams securely. Real-time updates ensure everyone has the latest data at their fingertips. There are workspaces for collaboration. Power BI service works on all web browsers.
Power Q&A: AI-Powered Natural Language Query
With Power Q&A, you can ask questions in plain language. The AI generates charts and gives you quick answers. Power Q&A understands synonyms and context. The more you use it, the better it becomes.
Power BI Gateway: Secure Data Connection Between On-Site Data and Cloud Services
Power BI gateway closes the gap between local data and the Power BI cloud. It ensures that data transfers take place securely. Cloud reports get updated with planned refreshes. It supports Oracle, SQL Server, and other sources.
Power BI Report Server: On-Site Report Hosting
Power BI Report Server lets startups host reports on their own servers. It gives you full control over data and access. You can view reports on mobile apps or the web portal. The server supports paginated reports and Power BI.
Power BI Embedded: Integration of Power BI Reports into Custom Apps
Power BI Embedded lets you add reports to apps. You can provide analytics within your software. You don’t need another Power BI license for the end user. Power BI Embedded makes smooth integration possible with APIs.
Also Read: Is Power BI Right for Your Startup? Evaluation Checklist
Microsoft Excel for Financial Reporting
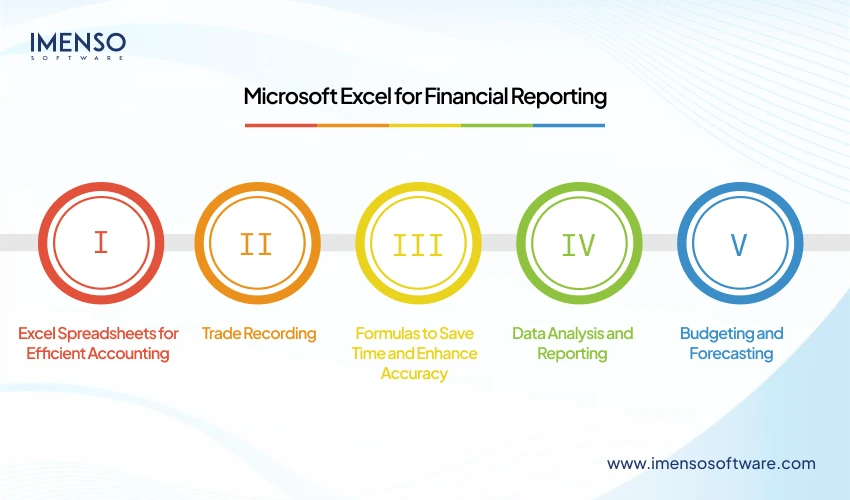
Accurate financial reports are critical for startups. Microsoft Excel is an integral tool for this purpose. Let’s look at the various ways it helps with modern reporting.
Excel Spreadsheets for Efficient Accounting
Spreadsheets lie at the core of Excel. Accountants use it to organize and manipulate data. Spreadsheets help enhance various tasks. All these, in turn, lead to better reporting.
Trade Recording
In an Excel sheet, you can record daily trades. These include income, expenses, and other activities. This systematic recording simplifies tracking.
Formulas to Save Time and Enhance Accuracy
Excel has various built-in formulas. This cuts the time spent on manual estimates. Excel automates processes like IRR and NPV. These are complex calculations. Their automation reduces the risk of errors during report creation.
Data Analysis and Reporting
Gaining insights from raw data is critical. Excel has sorting and filtering abilities. These let you organize data based on specific criteria. It leads to a more focused analysis. Pivot tables in Excel merge large datasets into a summarized format. This makes way for clear and concise reports.
Budgeting and Forecasting
With Excel, you can create detailed budgets. These budgets have clear outlines for estimated income and expenses. By feeding real-time data into Excel, you can adjust budgets per your needs. This lets you generate forecasts for future trends.
Advanced Excel Features for Reporting
Excel has more to offer. Besides the core ways above, the tool has many advanced features. Using them helps you create even more insightful reports.
Macros
With Macros, you can automate repetitive tasks. These are a string of pre-recorded commands. You can use it to simplify report generation.
Data Validation
Excel has various data validation tools. These let you set specific criteria for data entry. It cuts the error rates.
Data Visualization
Insightful reports turn numerical data into aesthetic visual formats. This leads to clear communication. Excel has many chart types. They let you present any financial data in an easy-to-grasp report.
Power Query
Power Query handles large data from diverse sources. It’s an add-on feature that helps with various processes. These include data import, manipulation, and cleansing. Thus, it converts data into a usable format.
Power BI vs. Excel: A Comparison of Key Abilities
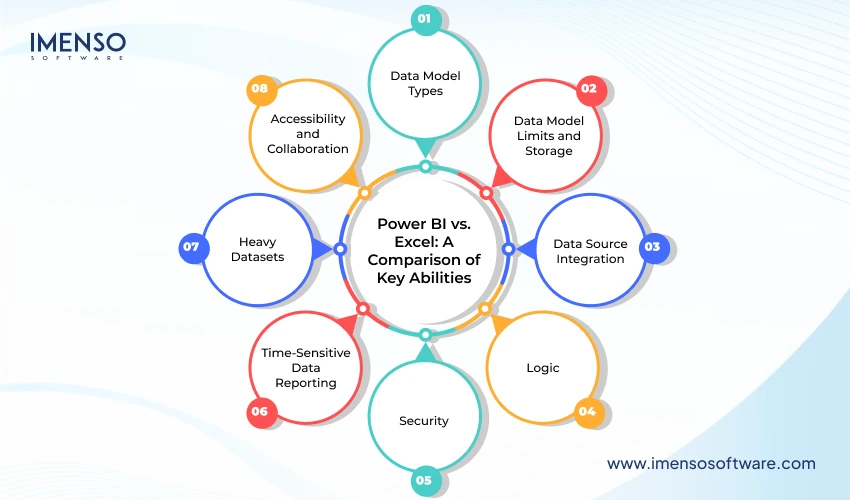
It’s critical to know that Power BI and Excel analyze various datasets. Both of them present the data in visual formats like charts and tables. Below is a comparison of their key abilities. This will help you decide which one is right for your reporting needs.
Data Model Types
A data model optimizes the data for analysis. Both Power BI and Excel have Power Query for data modeling. But the feature works a bit differently in both.
The variation is in the data model’s structure. It affects you if you work with a single table than in a model with relationships between tables. Excel has the add-on Power Pivot.
Power BI has an analysis service. Both support a full relationship model. Here, the organization of data is into a central fact table. This is surrounded by dimension tables. This makes both tools distinct from others with the same features.
Data Model Limits and Storage
In Excel, there are limited data model tables. The data model also has limited use within the workbook. You cannot access a data model external to the workbook.
The Power BI Desktop uses a local Analysis Services instance. It uses this for local needs. There are limits to Power BI in this mode. But in live connect DirectQuery, there aren’t any such limits.
With the Power BI Desktop, you can deploy the data model to the Power BI service. This leads to a robust client-server architecture. So, the model becomes accessible to Excel and Power BI reports.
Data Source Integration
Excel offers native connectivity to import external data. It uses Power Query to import data from varied sources. But Excel’s Power Pivot data model does not have DirectQuery connection type. DirectQuery lets you link to a data source in real-time. You access the latest version of the data without moving it into the data model.
Power BI is much better in this regard. It can link to endless databases. It supports links to flat files, apps, and more. Power BI supports DirectQuery. So, you can make dashboards that show KPIs, trends, and more in a visually pleasing way.
Logic
Both Power BI and Excel use DAX to define calculation logic. With DAX, you can create custom formulas. So, you can run complex logic within tables.
DAX lets both Excel and Power BI perform calculations swiftly. This is so even when there are large datasets.
Security
Excel offers file-level protection via encryption. It gives you read-only access and controls user actions within a spreadsheet. But these features aren’t enough for highly sensitive data.
Power BI’s import mode offers similar security. But this isn’t the case when deployed on the Power BI server. Power BI server runs granular security rights. It lets you define the exact security permissions. Thus, you have more control over who accesses the data.
In Direct Query mode in Power BI, users must authenticate with the core data source to access the data. This further boosts security.
Time-Sensitive Data Reporting
This is a critical feature to compare both tools against. Excel does not support automatic data refresh. You can only do so with Visual Basic for Applications. Another option is to code to automate the processes. But this drains your time.
Here again, Power BI is a clear winner. It has built-in features for real-time data updates. Power BI supports various methods for data refresh. You can set up streaming services to update data in real time. It also lets you define intervals for automatic data refresh.
Heavy Datasets
Excel is suited for storing and assessing datasets with less than 1 million records. It cannot handle datasets bigger than 500 MB. You can use Power Pivot in Excel for bigger datasets. But you’ll still face performance issues.
This isn’t the case with Power BI. It can process billions of records. Power BI has smart compression algorithms. They minimize data size and cache it on import. This is extremely valuable for startups that handle large datasets.
Accessibility and Collaboration
Excel has real-time collaboration features. In the web browser, you can use Excel Online. Users can also integrate Excel with Microsoft Teams. But these features don’t prove enough in an enterprise setup. Fragmented Excel files across cloud systems make it hard to uncover insights.
Power BI’s collaboration options are much better. The Power BI Service securely shares data. You can publish data to your desired location. Once you publish your content, the service refreshes automatically. Thus, you don’t have to re-share it again. It has granular security controls. This boosts data integrity.
Ease of Use
Excel is a familiar tool in every workplace. People know each part of its interface. This lets them quickly run the processes they want.
Power BI isn’t that well-known. But the tool has an intuitive interface. The drag-and-drop UI simplifies report creation. It lets you create stunning visualizations in minutes. But to use it effectively, you must learn its advanced features. This can take time. But it is well worth the investment.
Finding the Right Fit for Your Reporting Needs
Power BI and Excel are robust reporting tools. To pick one, you need to consider your reporting needs. Excel is an easy-to-use and versatile tool. It’s great for financial analysis and creating tabular reports. Power BI is a more advanced offering by Microsoft. The software is built to visualize complex data and create compelling reports.
Startups with complex data needs will find Power BI a perfect fit. Those with simpler data requirements can use Excel for accurate financial reports. Looking into your distinct needs will help you choose the tool that gives you insights into your operations, so you benefit from strategic decision-making.
Frequently Asked Questions
Is Power BI good for financial reporting?
Yes, Power BI has many visualization options. These include charts, tables, and more. With their help, you can create interactive reports. These reports offer clarity into a company’s data.
Is Power BI really better than Excel?
Excel is suited for small datasets. It is flexible and easy to use. It also offers many formatting options. But if you want real-time insights from data, Power BI scores over Excel.
Can I replace Excel with Power BI?
Power BI is better than Excel in the analysis of complex data sets. It also helps with creating interactive dashboards. But it may not be wise to fully replace Excel with Power BI. For tasks like simpler data transformation, Excel will be a good option.
Will AI replace Power BI?
AI cannot directly replace Power BI. The BI tool excels at exploring data from various angles. Through this, it uncovers precious insights. AI can best enhance the features of Power BI. It will complement Power BI rather than replace it.
Want more information about our services?


Similar Posts

Is Power BI Right for Your Startup? Evaluation Checklist
“Information is the oil of the 21st century, and analytics is the combustion engine,” Peter Sondergaard, Gartner Research. For a startup to succeed, it needs powerful apps. Data solutions that help it meet the expanding demands are critical for growth. Power BI is one such tool that enables startups to thrive. The business intelligence software […]...

8 Mistakes Businesses Make When Adopting Power BI and How to Avoid Them?
Numbers have an important story to tell. They rely on you to give them a voice. ~ Stephen Few Did you know, data is ultimately an organizational asset? You can transform it into information that facilitates actionable-insights for your organization. Microsoft Power BI does just that. You can connect disparate data sets, transform, and clean […]...

Top DAX Functions Every Analyst Should Know in Power BI
Power BI is an advanced data analytics tool. Armed with robust business intelligence capabilities, it enables organizations to glean insights from data. Over 5 million people globally use this BI tool for business analytics. DAX (Data Analysis Expressions) is a function library in Power BI. Using it, you can implement dynamic data management. DAX for […]...


