Building a Dynamic and Responsive Dashboard with ReactJS

Are you struggling to build a dynamic and responsive dashboard with ReactJS that captivates your users and delivers real-time insights? If so, you’re not alone. Creating an interactive and visually appealing dashboard can be a complex endeavor, requiring a deep understanding of ReactJS and its ecosystem. But fear not! We have the perfect solution to guide you through this exciting journey.
In this blog, we will unravel the secrets to building a dynamic and responsive dashboard with ReactJS that will leave your audience amazed. Whether you’re a seasoned developer or just starting with ReactJS, our comprehensive guide will provide you with the knowledge and tools you need to create an impressive dashboard that meets your users’ needs.
From meticulous planning and intuitive design to seamless data fetching and visualization, we’ll walk you through each step of the process. You’ll learn about best practices for component architecture, responsive layouts, user interactions, real-time updates, performance optimization, and more. By the end of this blog, you’ll have a solid foundation to build your own exceptional dashboard that stands out from the crowd.
So, are you ready to embark on this exciting journey? Let’s dive in and unlock the potential of ReactJS to create a dynamic and responsive dashboard that will elevate your data visualization game to new heights!
Planning and Design 
Before diving into the code, it’s crucial to plan and design your dashboard carefully. The planning and design phase of building a dynamic and responsive dashboard with ReactJS is crucial for setting the direction and vision of your project. It involves defining the goals and objectives, identifying key metrics and data sources, sketching wireframes, establishing a visual hierarchy, considering responsiveness, iterating through the design process, prioritizing accessibility and usability, and emphasizing collaboration and documentation.
During the planning and design phase, consider the following key steps
- Define clear goals and objectives for the dashboard, ensuring alignment with the intended purpose and target audience.
- Identify key metrics and data sources that need to be visualized, taking into account the frequency of data updates.
- Sketch wireframes and user flows to visualize the layout and structure of the dashboard, allowing for quick iterations and improvements.
- Establish a visual hierarchy using typography, color schemes, and spacing to guide users’ attention to important information.
- Ensure responsiveness and mobile-friendly design, adapting the dashboard seamlessly to different devices and screen sizes.
- Follow an iterative design process, seeking feedback from stakeholders and users to refine designs based on their input.
- Prioritize accessibility and usability, adhering to WCAG standards and focusing on intuitive navigation and clear labels.
- Foster effective collaboration with team members, utilizing collaboration tools and documenting design decisions.
- Emphasize the importance of documentation to maintain consistency and facilitate future development or design iterations.
Setting Up the Project 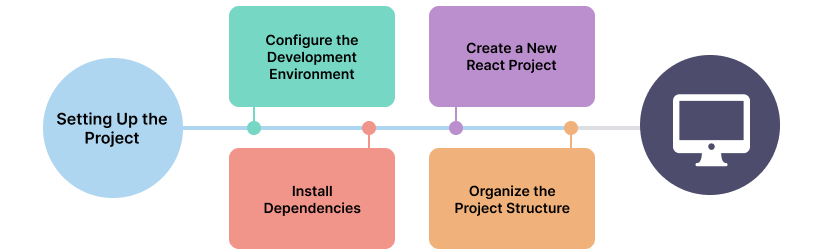
Setting up the project is the initial step in building a dynamic and responsive dashboard with ReactJS. This phase involves configuring the development environment, installing necessary dependencies, and organizing the project structure.
Here is a step-by-step guide for setting up your project
- Configure the Development Environment: Ensure that you have Node.js installed on your machine, which provides the necessary runtime environment for running React applications.
- Create a New React Project: Use Create React App (CRA) to automate the project setup process. This tool generates a new React project with the necessary files and configurations.
- Install Dependencies: Identify the dependencies your dashboard requires, such as data visualization libraries or UI component libraries, and install them using a package manager like npm or Yarn.
- Organize the Project Structure: Maintain a well-organized codebase by structuring your React project effectively. Create directories like “components,” “styles,” “assets,” and “data” to separate different aspects of your project. Within the “components” directory, you can further organize your components based on functionality or features.
- Start the Development Server: Launch the development server to view your project in the browser. This server provides live updates as you make changes to the code, allowing you to see the dashboard evolve in real time.
By following these steps, you can set up your project correctly and establish a solid foundation for building a dynamic and responsive dashboard with ReactJS.
Component Architecture
The component architecture is a crucial aspect of building a dynamic and responsive dashboard with ReactJS. It involves designing and structuring the various components that make up the dashboard interface. An effective component architecture promotes reusability, modularity, and scalability, facilitating easier maintenance and future enhancements.
- To create a robust component architecture: Identify Dashboard Components: Determine the necessary components for your dashboard, such as header, sidebar, charts, tables, and filters, based on the required functionalities and features.
- Create Reusable Components: Design modular and self-contained components that can be reused across the dashboard or in future projects. This approach minimizes code duplication and improves development efficiency.
- Establish Component Hierarchy: Define the relationships and hierarchy between components to organize their structure effectively. Identify main container components and nested components to manage state and data flow efficiently.
- Manage State and Data Flow: Plan how data will be passed between components and how the state will be managed. Choose suitable state management approaches, such as lifting the state up, using context, or leveraging state management libraries like Redux.
- Consider Component Responsiveness: Design components to be responsive, ensuring they adapt well to different screen sizes and devices. Implement responsive layouts using CSS techniques like media queries, flexbox, or CSS Grid.
- Implement Styling and Theming: Apply consistent styling to components using CSS or CSS-in-JS libraries like styled-components or Emotion. Consider utilizing theming to switch between visual styles or customize the theme to align with the dashboard’s branding.
- Test and Refine Components: Conduct thorough testing of each component to ensure functionality and responsiveness. Employ testing tools like Jest and React Testing Library to write unit and integration tests. Continuously refine components based on user feedback and usability testing.
Fetching and Managing Data
Fetching and managing data is a crucial aspect of building a dynamic and responsive dashboard with ReactJS. It involves retrieving data from various sources and efficiently handling and updating that data within the dashboard.
To fetch and manage data effectively
- Define Data Requirements: Identify the specific data sets or metrics required for your dashboard. Determine the data sources, whether APIs, backend servers, or local storage.
- Fetch Data from Sources: Use JavaScript libraries like Axios or Fetch API to make HTTP requests and retrieve data from the defined sources. Handle asynchronous operations using promises or async/await for efficient data retrieval.
- Handle Data Loading and Errors: Display loading indicators or skeleton screens to provide feedback to users during the data fetching process. Implement error handling to handle failed or erroneous data retrieval gracefully.
- Manage Data State: Utilize React’s state management capabilities, such as hooks like useState or useReducer, to store and update the fetched data. This ensures components are re-rendered efficiently based on data changes, resulting in a responsive dashboard.
- Implement Data Filtering and Sorting: Allow users to filter and sort the displayed data. Enable users to specify filtering criteria and sorting options, providing a customized experience.
- Apply Data Visualization Techniques: Utilize data visualization libraries, such as D3.js or Chart.js, to present the fetched data visually. Select appropriate chart types or graphs based on the data nature and insights you want to convey.
- Update Data Responsively: Ensure the dashboard updates data in real-time or at specified intervals to reflect the most up-to-date information. Implement mechanisms to refresh data or use real-time data streaming techniques.
Responsive Layouts
Creating responsive layouts is a crucial aspect of building a dynamic and user-friendly dashboard with ReactJS. A responsive layout ensures that your dashboard adapts seamlessly to different screen sizes and devices, providing an optimal viewing experience for users. Let’s explore the key considerations for implementing responsive layouts:
- Mobile-First Approach: Adopt a mobile-first approach when designing your dashboard. Start by designing and optimizing the layout for smaller screens, then progressively enhance it for larger screens. This approach prioritizes essential content and functionality on mobile devices.
- Fluid Grid System: Utilize CSS grid systems, such as Bootstrap Grid or CSS Grid, to create flexible and responsive layouts. Grid systems allow you to define a grid structure that automatically adjusts and rearranges elements based on screen size, providing a consistent and responsive design.
- Media Queries: Implement media queries to apply specific styles based on different screen sizes. By defining breakpoints, you can target specific ranges of screen widths and apply custom CSS rules accordingly. This allows you to optimize the layout and appearance of your dashboard at different breakpoints.
- Flexible Units: Use relative units, such as percentages or viewport units (vw and vh), for sizing elements and defining spacing. Relative units ensure that components and containers scale proportionally with the viewport, accommodating various screen sizes.
- Responsive Typography: Consider responsive typography by using CSS techniques like viewport-based units (vw) or media queries to adjust font sizes based on screen size. This ensures readability and legibility across different devices.
- Dynamic Content Layout: Design your dashboard to handle dynamic content effectively. Ensure that components and containers adapt to varying content lengths and adjust their layout accordingly. Avoid fixed heights or widths that might result in content overflow or unnecessary white space.
- Test Across Devices: Regularly test your dashboard on different devices and screen sizes to ensure a consistent and optimized experience. Use device emulators or responsive design testing tools to simulate various viewports and identify any layout issues.
Data Visualization
Data visualization is a critical aspect of building a dynamic and informative dashboard with ReactJS. It involves presenting complex data in a visual format that is easily understandable and actionable for users. Effective data visualization enables users to gain insights, identify patterns, and make informed decisions. Here are key considerations for implementing data visualization in your dashboard:
- Select Appropriate Chart Types: Choose the right chart types based on the data you want to visualize and the insights you want to convey. Bar charts, line charts, pie charts, and scatter plots are commonly used, but consider other options like heat maps, treemaps, or network diagrams based on the nature of your data.
- Visualize Data Hierarchies: If your data has hierarchical relationships, consider using hierarchical visualization techniques such as tree maps, sunburst charts, or nested pie charts. These visualizations help users understand the hierarchical structure and analyze data at different levels of detail.
- Highlight Key Metrics: Emphasize important metrics or data points by using color, size, or visual cues. Use data visualization techniques like sparklines, bullet charts, or gauges to highlight key performance indicators (KPIs) or trends effectively.
- Interactive Data Exploration: Enable users to interact with the data visualization by incorporating interactive elements such as tooltips, drill-down capabilities, or filters. This allows users to explore and analyze the data based on their specific needs and interests.
- Responsiveness: Ensure that the data visualization components are responsive and adapt to different screen sizes and devices. Responsive design techniques like fluid layouts or mobile-friendly interactions guarantee optimal viewing experiences across various devices.
- Accessibility: Consider accessibility standards when designing data visualizations. Ensure that the visualizations are perceivable by users with visual impairments by providing alternative text, high contrast, or auditory cues where applicable.
- Performance Optimization: Optimize the performance of data visualization components by handling large datasets efficiently. Implement techniques like data aggregation, lazy loading, or pagination to ensure smooth rendering and interaction.
User Interactions and Filtering
Enhancing user interactions and filtering capabilities in your ReactJS dashboard is crucial for providing a dynamic and personalized user experience. These features allow users to customize their data viewing, explore specific information, and gain deeper insights. Key considerations include:
- Interactive Components: Implement intuitive and interactive components such as buttons, dropdowns, and checkboxes for seamless user interactions.
- Filtering and Search: Enable users to filter data and perform quick searches to focus on relevant information within large datasets.
- Dynamic Updates: Ensure real-time updates when filters or user selections change to provide instant feedback and responsiveness.
- Sorting and Ordering: Allow users to sort data based on criteria such as date, value, or alphabetical order for efficient data analysis.
- Drill-Down Functionality: Provide the ability to drill down into detailed information from summarized views, facilitating deeper data exploration.
- Visual Feedback: Use visual cues and feedback to indicate user interactions, such as highlighting selected items or animating transitions.
- User Customization: Offer customization options that enable users to personalize their dashboard experience, save preferences, or customize layouts.
Real-Time Updates
Integrating real-time updates into your ReactJS dashboard enhances responsiveness and ensures users have access to the latest data without manual refreshes. Real-time updates enable users to monitor changes, track live data, and make informed decisions. Key considerations include:
- WebSocket or Server-Sent Events: Establish a persistent connection between the client and server using WebSocket or Server-Sent Events (SSE) to receive real-time updates without continuous polling.
- Data Streaming: Utilize data streaming techniques like WebRTC or MQTT to receive live data streams and update the dashboard in real-time.
- Event-Based Architecture: Design the dashboard using an event-driven architecture, defining events for data updates and triggering UI updates with event handlers.
- State Management: Utilize state management libraries like Redux or the Context API to handle real-time data updates and ensure components are subscribed to the relevant data streams.
- Optimized Fetching: Implement efficient data fetching strategies, like debouncing or throttling, to control the frequency of updates and optimize performance.
- Real-Time Data Visualization: Update visualizations dynamically as new data arrives, leveraging libraries like D3.js or Chart.js with real-time rendering capabilities.
- Error Handling and Reconnection: Gracefully handle connection failures, providing error messages and implementing reconnection mechanisms to maintain uninterrupted real-time updates.
Performance Optimization
Optimizing the performance of your ReactJS dashboard is essential for delivering a fast and responsive user experience. Follow these key strategies to enhance performance:
- Code Splitting: Divide your application into smaller, manageable chunks using code-splitting techniques. This enables lazy loading and reduces initial load times.
- Minification and Compression: Minify and compress your code, including JavaScript, CSS, and HTML files, to reduce their size and improve loading speed.
- Caching: Implement browser caching mechanisms to store static assets locally, minimizing server requests and improving subsequent load times.
- Debouncing and Throttling: Control the frequency of events and API requests using debouncing and throttling techniques. This prevents excessive rendering and optimizes data fetching.
- Memoization: Cache the results of expensive function calls or calculations using memoization. This eliminates redundant computations and improves overall efficiency.
- Virtualization: Apply virtualization techniques for large lists or data grids to render only the visible portion, reducing rendering time and memory usage.
- Performance Profiling: Regularly analyze performance using tools like React DevTools or browser developer tools. Identify bottlenecks, optimize rendering, and eliminate unnecessary re-renders.
Testing and Deployment
Testing and deployment are crucial stages in the development process of a dynamic and responsive dashboard built with ReactJS. Proper testing ensures the functionality and quality of your dashboard, while efficient deployment ensures its availability to users. Here are key considerations for testing and deploying your ReactJS dashboard:
- Unit Testing: Write comprehensive unit tests for components and functions using testing frameworks like Jest or React Testing Library to ensure individual units work correctly.
- Integration Testing: Perform integration tests to validate the interaction between components and modules. Tools like Cypress or Enzyme can simulate user interactions and test overall functionality.
- End-to-End Testing: Conduct end-to-end tests to verify the dashboard’s behavior as a whole, simulating user scenarios and interactions.
- Automated Testing: Implement automated testing pipelines with CI/CD tools for consistent quality control and effortless testing on code changes.
- Performance Testing: Assess dashboard responsiveness and scalability with tools like Lighthouse or Apache JMeter, identifying areas for improvement.
- Deployment Strategies: Choose suitable deployment strategies like continuous deployment or blue-green deployment for seamless releases.
- Version Control and Release Management: Use Git for version control and efficient release management.
- Monitoring and Error Tracking: Set up monitoring tools like New Relic or Sentry to track performance and identify issues in production.
- User Acceptance Testing: Involve users or stakeholders in testing to gather feedback and validate usability.
- Security Testing: Conduct security tests, including penetration testing and code reviews, to address potential vulnerabilities.
Conclusion
Building a dynamic and responsive dashboard with ReactJS is an exhilarating endeavor that requires careful planning, thoughtful design, and precise implementation. Throughout this blog, we have explored various aspects of dashboard development, from setting clear goals and objectives to optimizing performance and ensuring real-time updates. By following the best practices and strategies outlined here, you can create a visually stunning and user-friendly dashboard that effectively presents data and empowers your users.
However, if you find yourself needing expert assistance in developing a top-notch dashboard, look no further than Imenso Software. Our team of experienced ReactJS developers specializes in crafting custom dashboards tailored to your specific requirements. With their expertise and deep understanding of ReactJS, they can bring your vision to life and deliver a powerful dashboard solution that exceeds expectations.
Want more information about our services?
Similar Posts

App Design – How We Build Better Applications With Behavioral Psychology & Design Principles
Hundreds of thousands of apps, no-code tools, digital products, and millions of websites are available over the internet. While some are great successes, others don’t even exist for a large population. Only a few products succeed in hitting their target market and explode, while others live in the abyss of the internet. ...

Web Application Development: A Complete Guide
Building a web application to accelerate business revenue but not knowing where to start? Here is a full web app development guide for everything you will need. In the long-forgotten time, it is creating a website combined HTML, CSS, and basic JavaScript code. Simple, colorful, and sharp, that is how a web app was on […]...

The Future of Online Shopping: Personalized Assistance with ChatGPT
The world of e-commerce has seen tremendous growth over the past few decades, with more and more consumers opting to shop online for convenience, variety, and competitive pricing. However, as online shopping continues to evolve, so do consumer expectations. One of the key trends shaping the future of e-commerce is the integration of artificial intelligence […]...


