The Evolution of Business Intelligence: Why Power BI Is Leading the Charge

According to Straits Research, the business intelligence (BI) market was worth USD 36.82 billion in 2025. It will expand to USD 116.25 billion by 2033. This is by no means a small figure. Big data is a hot term in business circles. It entails all the information that a company gathers and stores. A distinctive trait of big data is that it keeps growing daily.
Big data is a hidden gem for businesses. But not everyone can uncover the value buried in it. Analyzing this data is critical to gaining precious insights from it.
Enter Power BI.
The BI tool has robust data analysis and visualization capabilities. It enables businesses to obtain hidden insights from their data. Thus, companies of varied sizes can make data-led decisions, boosting their growth.
How Has Business Intelligence Evolved Over the Decades?
Modern BI isn’t the same as what it once was. The concept is traceable to the mid-1800s. Richard Miller first used the term business intelligence in 1865. He used it to explain the profits that Sir Henry Furnese gained from using timely data.
In 1958, BI concepts were formalized with Hans Peter Luhn’s IBM article. In the 1960s, data exploded at an alarming rate. The tech stack of the time couldn’t keep pace with the growing data. So, by the 1970s, the first BI tools emerged.
BI remained dependent on IT till the early 2000s. But then the rise of the internet brought forth BI 2.0. Today, tools like Power BI are helping teams across an organization. Their primary job is to offer real-time insights. These insights guide sound decisions. Business intelligence in Power BI is now vital for companies of varied sizes.
What Is Power BI?
Power BI is a cloud-based app group of business analytics tools. It allows you to connect to, visualize, and analyze data quickly and with more understanding. You can connect to a range of live data via user-friendly dashboards. Two notable Power BI features are AI-powered insights and interactive reports. They form the crux of business decisions and data visualization.
You can download Power BI for Windows 10 or Windows 11. Native mobile apps are available for Windows, Android, and iOS devices. The Power BI Report Server is for businesses that need to maintain their data and reports on-site.
“It has gotten our key decision makers out of the weeds by providing them with metrics they need to do their job, and not have to wrangle the data to get answers. Flexibility, interactivity … just jump in.”
Daksha R
Manager, Clinical Research Analytics
How Has Power BI Revolutionized Business Intelligence?
Power BI turns raw data into meaningful insights. It has features that help with collecting and transforming data. Then, the tool analyzes this information and visualizes the data. This helps startups make data-driven decisions. Power BI capabilities are integral to a startup’s digitization. Below are all the ways in which it helps.
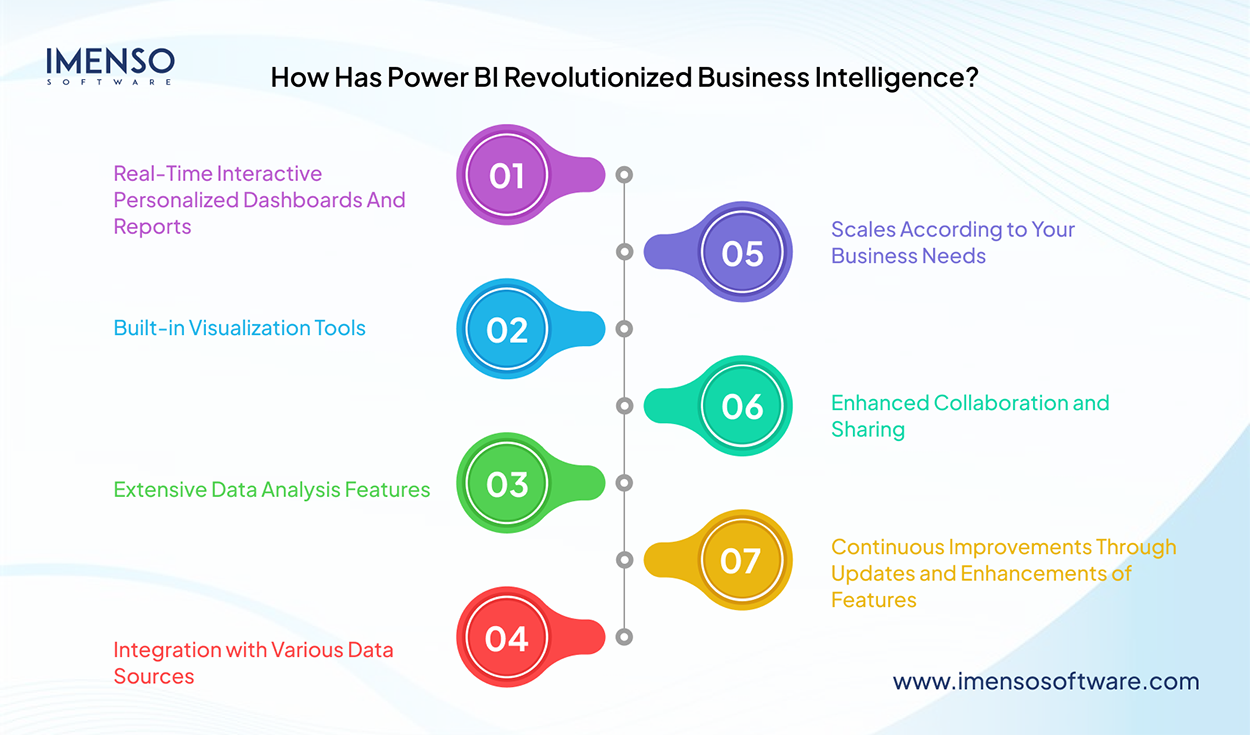
1. Real-Time Interactive Personalized Dashboards And Reports
Power BI offers interactive dashboards and report options. These let you collect, summarize, and present data visually. You can customize them based on your needs. Below are various ways in which they help with business intelligence.
- Helps you explore data at varying levels of detail.
- Apply a cross-filter by choosing a data point in one visual. It filters other visuals on the same report.
- The presence of filtering options for users to slice data by various dimensions.
- Save the current state of a report page and switch between different views quickly.
A crucial advantage of dashboards and reports in Power BI is that they function in real-time. It means they get updated with the latest data in real time. Thus, they offer real-time insights. It enhances operational efficiency and allows for quick decision-making.
2. Built-in Visualization Tools
Built-in visualization tools enable you to make sense of complex datasets. It has the following visual elements:
-
Bar and Column Charts
These are for comparing values across categories.
-
Line and Area Charts
Line and area charts display trends over time.
-
Pie and Donut Charts
Use them to present proportions.
-
Scatter and Bubble Charts
These display the link between two variables.
-
Basic, Filled, and ArcGIS Maps
Maps help visualize data geographically.
-
Tables and Matrices
Tables and matrices are suitable for comprehensive data representation.
-
Cards and KPIs
Use cards and KPIs to highlight critical metrics.
3. Extensive Data Analysis Features
One of the key features of Power BI to derive deeper insights is its capacity to analyze data. The tool has various capabilities for this task. These are:
-
DAX (Data Analysis Expressions)
DAX lets you create custom calculations and measures. It has systems like clustering and forecasting. So, you can deeply explore data. This increases your chances of spotting patterns and insights.
Let’s suppose you need to analyze sales performance. Using DAX, you can create custom measures to assess sales performance across locations and product categories. This helps you discover bestselling products and areas with high demand. -
Power Query
This data preparation tool lets you ingest, integrate, modify, and enhance data. Power Query supports a range of data sources. It performs ETL (Extract, Transform, Load), making it critical for data analysis.
-
AI Integrations
Power BI capabilities include predictive analytics, NLP, and ML. These features automate data analysis. They offer deep learning from data. Thus, you can act on it, no matter its complexity.
For example, predictive analytics lets you create models to anticipate sales trends. These insights help you improve your current outlook on demand. You can take the steps needed to optimize supply chain operations.
4. Integration with Various Data Sources
A key Power BI functionality is its integration features. Power BI can integrate with a range of data sources. These are:
Databases
- SQL Server
- Oracle
- MySQL
- PostgreSQL
- Teradata
- IBM DB2
Cloud Services
- Azure SQL Database
- Azure Data Lake
- Azure Blob Storage
- Google BigQuery
- Amazon Redshift
- Snowflake, and more.
Data Warehouses
- Azure Synapse Analytics
- Google BigQuery
- Amazon Redshift
Big Data
- Hadoop
- Spark
- Hive
Online Services
- Google Analytics
- Salesforce
- Dynamics 365
- SharePoint Online
- Adobe Analytics
Flat Files
- Excel
- CSV
- XML
- JSON
This integration makes Power BI a robust data analytics system. It can reach data from any source. The data sources get frequent updates, too. So, it makes you benefit from detailed and accurate reports.
5. Scales According to Your Business Needs
Power BI is extremely scalable. So, it is suited for companies of all sizes.
a. For Startups
Power BI offers an affordable solution that adapts to the changing needs of your company. It handles smaller datasets but rapidly scales to manage more complex data.
b. For Large Businesses
Big businesses can deploy various dashboards and reports for different departments. Power BI ensures that each team has the data needed for strategic decisions.
c. Programs for Specific Sectors
Power BI’s real-time dashboards enable businesses in various sectors to constantly track sales trends, financial performance, and patient data. This encourages rapid responses to rising trends and challenges.
d. For Multinational Corporations
Power BI’s cloud abilities deploy BI solutions across multiple countries. This ensures consistent data reporting and analysis for MNCs.
6. Enhanced Collaboration and Sharing
Power BI functionalities allow for smooth collaboration and sharing. There are channels for quick sharing of reports and dashboards. They have features for real-time collaboration. Another Power BI feature in this regard is the workspace. Workspaces let teams work together on one report. Every member can see what others are doing in real time.
These features help enhance the operational efficiency of a company in various ways. They allow for quick feedback and swift decision-making. Teams share data in real-time. This lets them adjust to changes proactively.
7. Continuous Improvements Through Updates and Enhancements of Features
Microsoft regularly enhances Power BI functionalities. It releases monthly updates for the tool. These updates consist of new features. They also make the existing ones more powerful. The updates enhance the performance of the tool, too. All of this ensures that you retain your competitive edge.
Microsoft actively interacts with the Power BI community. It does so via forums and feedback channels. The goal is to discover and integrate new ideas into the tool, enhancing it further. It ensures that Power BI never falls short of meeting the user’s needs.
Some recent updates have been around AI capabilities and data connectors. These updates let you uncover insights faster than before. It, in turn, makes way for quicker strategic decisions.
Power BI Benefits Over Excel
Power BI and Excel both have advanced analytics and visualization features. Still, Power BI scores over Excel in various ways.
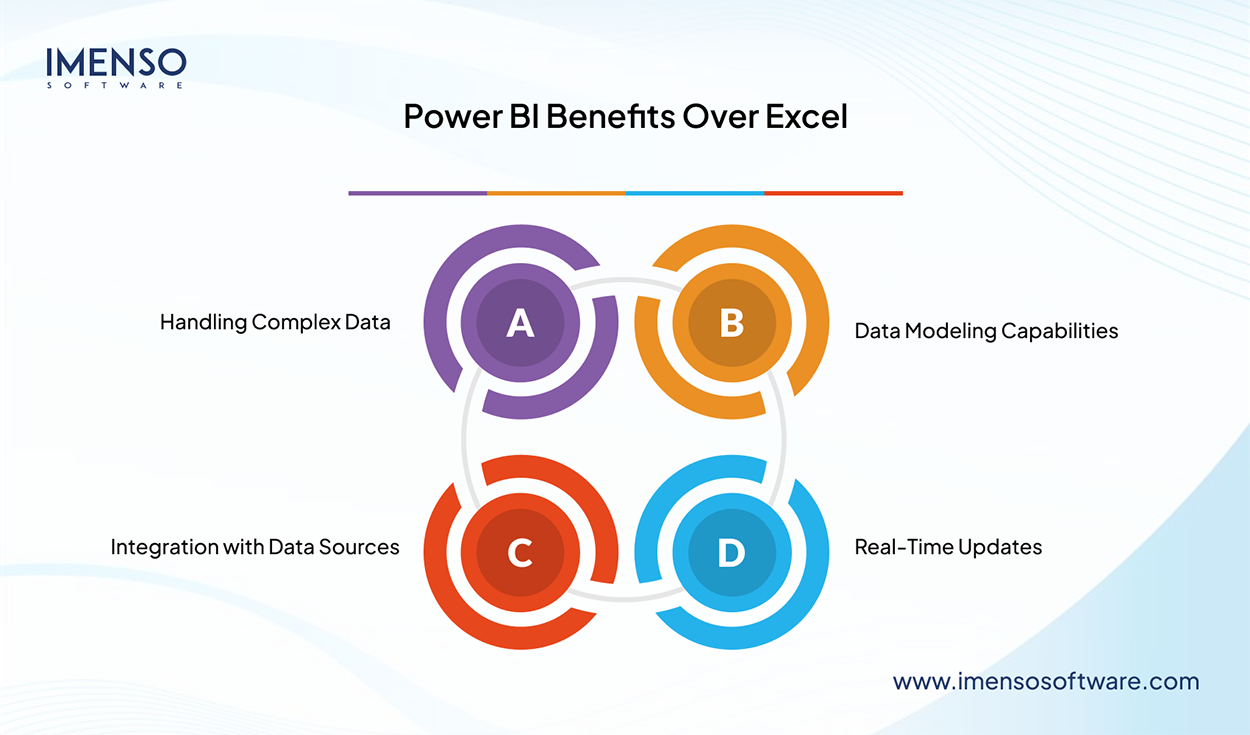
Handling Complex Data
Power BI features include an in-memory processing engine. This robust tool analyzes millions of data rows. It also creates data-driven dashboards.
Excel isn’t built to analyze large datasets. When given this task, it exhibits long delays and performance issues.
Data Modeling Capabilities
Data modeling is one of the key features of Power BI. It supports linkages between tables. So, it simplifies the creation of advanced reports and dashboards from complex data sets quickly.
In contrast, Excel’s modeling capabilities are limited. It does not have AI and ML features present in Power BI. There is no real-time data streaming as well.
Integration with Data Sources
Power BI can integrate with various data sources. Not only to Microsoft products, but it also connects to various third-party data sources. A few examples are Salesforce and HubSpot. This eliminates the need to switch between tools. It lets you use direct query connections to on-site and cloud databases for real-time updates.
Excel does not integrate with as many data sources. You can visualize data from CSV files and spreadsheets. Now it can also integrate with Power Query. Still, the data source range compared to Power BI remains limited.
Real-Time Updates
Power BI capabilities include direct query. It supports real-time data updates. This lets you spot trends and identify insights.This is one of the key Power BI benefits for a business. You can also collaborate with various stakeholders.
Excel does not have this feature. You can refresh data on schedule or manually only.
Advantages of Power BI over Tableau
Tableau is a visual analytics tool. Along with Power BI, it’s commonly used in the BI space. Tableau is more powerful than Excel in turning data into meaningful insights. Still, there are various areas where Power BI surpasses Tableau.
ETL/Data Discovery Suite
Power BI has various tools for ETL and data discovery. Tableau does not have this many options. In Power BI, you can build reporting data marts directly. There’s no need to get help from third parties.
Custom Visualizations
In Power BI, you can create your own custom visualization. This lets you present your data in compelling ways. You can also download pre-made visuals from the Power BI community.
Tableau has many built-in visuals. Undoubtedly, they are outstanding. But it still doesn’t give you the flexibility to create custom visualizations.
MSFT Integration
Power BI supports O365/Azure offerings and other Microsoft products. This makes it perfect for stores that operate on 0365 or Azure. Tableau can connect to a few Microsoft products. But the integration isn’t as seamless as Power BI.
Natural Language Query Support
Natural Language Query is a Power BI feature unique to this tool. It lets you input a question, and the BI tool chooses a visualization you can explore. This makes data accessibility more widespread.
Tableau also has a Natural Language Query. But it is not as advanced as Power BI’s. It doesn’t offer real-time collaboration. Natural Language Query in Tableau also lacks deep contextual understanding.
Ease of Use
If you’ve used a Microsoft product before, Power BI will seem familiar. It has a simple user interface that lets you perform all tasks swiftly. If you are an advanced Excel user, you’ll find the tool even easier to master. This is because it uses the same DAX query language.
Tableau has a steep learning curve. Learning and using the marks menu and advanced features takes much time.
Collaboration and Sharing
One of the major Power BI pros is its ability to create and share interactive reports. It makes collaboration seamless. Tableau has an in-built sharing option. But it does not have the depth of customization compared to Power BI.
Empowering Business Intelligence with Power BI
Power BI capabilities allow businesses to tap into their data and experience various aha moments. The tool scales based on your needs. Thus, it ensures that your business stays competitive. The coming years will see a rise in data modeling and automation. Power BI will surely lead the charge as it keeps evolving with the latest trends. In doing so, it makes you lead the way in data-driven decision-making.
Frequently Asked Questions
- What is the broad reason for a company to use business intelligence?
BI supports and promotes data-driven decision-making. It gives insights from information present in various areas. These include finance, sales, and marketing, among others. These insights help businesses to spot trends, issues, and patterns.
- Is Business Intelligence the same as Power BI?
Power BI isn’t the same as business intelligence (BI). Power BI is a BI tool. BI is the process of turning raw data into meaningful insights. These insights help a business benefit from strategic decision-making. Power BI is a tool used for BI processes. These include data visualization, analysis, and reporting.
- What is the best BI tool?
There isn’t a single answer to the best BI tool. Varied tools serve the needs of specific businesses. Still, some systems have made their mark because of the advanced analytics capabilities. These are Power BI, Tableau, and Zoho Analytics.
- What are the main components of business intelligence?
The main parts of BI are data gathering, data standardization, analysis, and reporting. All of these work together to turn raw data into precious insights. Businesses use these insights for informed decision-making.
Want more information about our services?


Similar Posts

Is Power BI Right for Your Startup? Evaluation Checklist
“Information is the oil of the 21st century, and analytics is the combustion engine,” Peter Sondergaard, Gartner Research. For a startup to succeed, it needs powerful apps. Data solutions that help it meet the expanding demands are critical for growth. Power BI is one such tool that enables startups to thrive. The business intelligence software […]...
10 Compelling Reasons to Switch from Excel to Power BI for Data Analytics
Microsoft Excel has been the preferred tool for business reporting for many years. Since 2015, when Microsoft launched Power BI – a “business intelligence” tool that delivers robust analytics and reporting capabilities, it has been simpler to comprehend and visualize complex data. The mindset of business owners began to change their approach and quickly changed […]...

Top 10 Data Visualization Tools for 2024
Are you feeling overwhelmed and unable to make sense of the sea of data available? You are not alone. Every day, we generate a large amount of data, about 402.74 million terabytes. And it’s only going to increase! This can be challenging for entrepreneurs, businesses, and individuals, making it difficult to find relevant information. According […]...


