Power BI for Non-Tech Executives: A Simple Guide to Smarter Business Decisions

Millions saw the apple fall, but Newton was the one who asked why.
~ Bernard Baruch
Ever looked at a sea of numbers and thought, There must be a better way to make sense of this?
You’re not alone! Because data isn’t just for data scientists; it’s for everyone!
The Microsoft Power BI is a great tool designed for non-technical professionals, too. So, you can transform your raw and unorganized data into actionable-insights without writing a single line of code.
Do you know, that the Business Intelligence market is projected to reach $59.7 billion by 2025? And, this tool can empower you in your journey in numerous ways.
Intriguing?
Let’s explore how Power BI can revolutionize the way you work with data, helping you to excel in your career and obtain favourable conclusions for your organization.
What is Microsoft Power BI Business Intelligence Tool?
Power BI is a tool designed by Microsoft to assess data and is user-friendly for technical and non-technical users. So even non-technical professionals can analyze and visualize very quickly and easily.
Key Features of Power BI
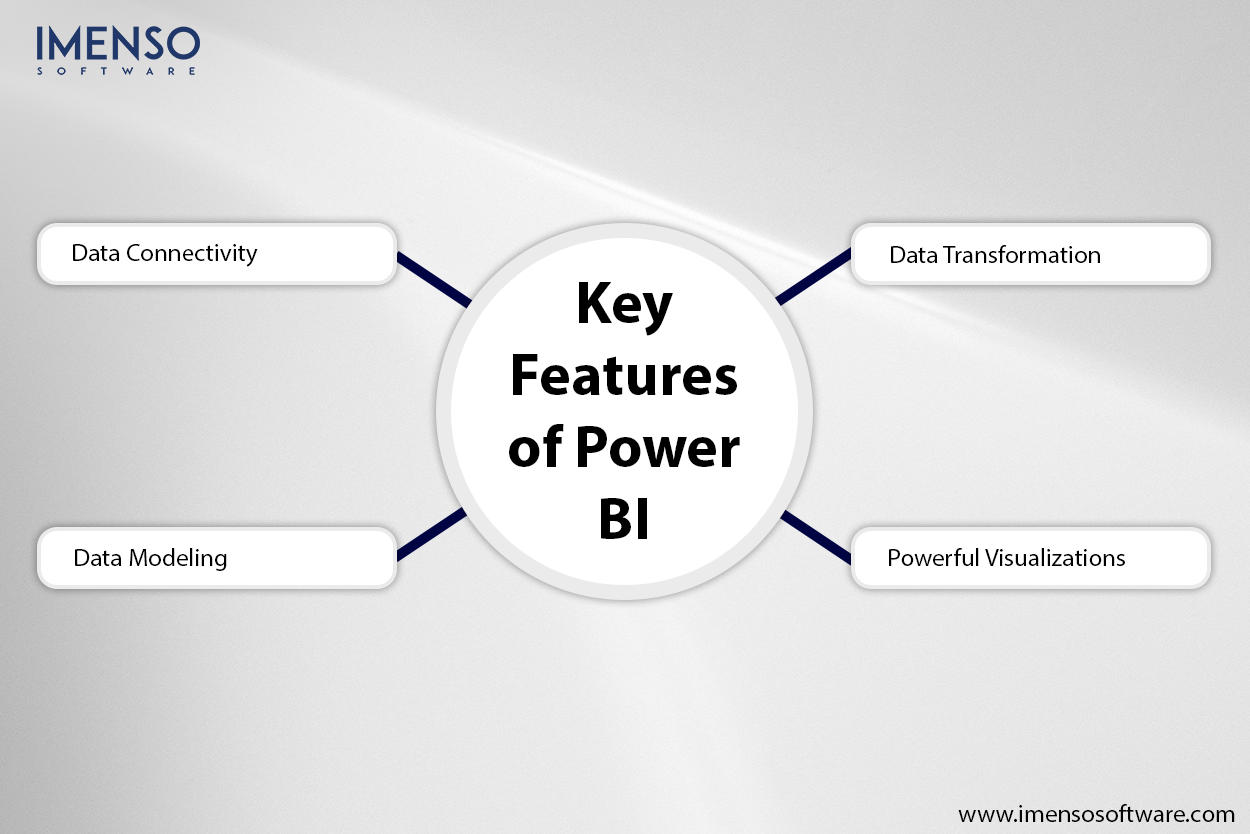
- Data Connectivity:
Power BI connects to a variety of data sources. Whether it’s an Excel file, cloud services like Azure, or third-party platforms like Salesforce, Power BI can pull it all together.
- Data Transformation:
The Power Query tool helps clean and transform data. You can combine datasets from different sources and get them ready for analysis without any hassle.
- Data Modeling:
You can create relationships between different datasets and build models. It’s all about making your data work together so you can see the bigger picture.
- Powerful Visualizations: Power BI offers all kinds of charts and graphs to help you visualize your data. You can create interactive reports that make trends and comparisons easy to spot.
Overview of the Power BI Platform:
- Power BI Desktop: This is a free desktop app where you can build reports and data models. It’s perfect for creating and exploring data before sharing your findings.
- Power BI Service: The cloud-based version lets you share reports and access them in real time. It makes sure everyone is looking at the latest data.
- Power BI Mobile: You can take your dashboards and reports with you. It’s perfect for decision-making on the go with the mobile app.
How Power BI Works for Non-Tech Executives?
You don’t need to be a data expert to get the most out of it. It has got the drag and drop setup which lets you do a lot. So, get ready to switch visuals, filter your data, spot trends, or build full dashboards without writing any code..
Here’s what you need to follow:-
Step-1 Pick the data you want to analyze.
Step-2 Choose from a variety of visualizations like charts, tables, and maps.
Step-3 Create interactive reports you can easily share with your team.
You can dive into your company’s data and make decisions in real time without waiting for IT to prepare reports with Power BI. Interesting?
Key Features of Power BI for Non-Tech Users
Power BI is packed with features that make it perfect for non-tech executives. Can’t believe?
Let’s break down some of the most important ones to help you make sense of your data with ease.
-
Intuitive Dashboards:
Dashboards are easy to use and you can set them up the way you want. You choose the data that matters most and see it clearly and simply. No more digging through messy spreadsheets. Everything you need is right in front of you.
-
Data Visualization:
Charts, graphs, and maps make data much easier to understand. Power BI transforms them into visuals where you’ll be able to spot key insights in seconds, even if you’re not a data expert.
-
Interactive Reports:
Your reports are interactive with Power BI. This means you can drill down into it and explore different angles in real time. Sound, fantastic? Also, you can click on a chart to see more details or filter the data based on different criteria. This gives you the flexibility to dive as deep as you need and draw better conclusions.
-
Natural Language Queries:
One of the coolest features for non-tech users is the natural language query. You can simply ask Power BI questions like “What were the total sales last quarter?” or “Which region has the highest growth?” Power BI will understand your question and give you the answer right away—no coding or complicated analysis required.
-
Collaborative Tools:
Power BI makes sharing your insights easy. You can share your reports and dashboards with everyone and let them access the latest data at any time. Collaboration becomes seamless and makes sure everyone stays aligned on business goals.
Power BI’s Impact on Business Decision
Make Decisions Without the Guesswork. Making good choices at work shouldn’t feel like a shot in the dark. These days, the most successful leaders use real data, not just gut feeling. That’s where the right tools come in. They show you clear facts so you don’t have to dig through spreadsheets or stay up late doing the math.
You’ll be able to move faster and feel more sure about your choices. Let’s look at how this kind of tool helps you make smarter decisions every day.
Real-Time Decision-Making
When you have live dashboards and automatic data updates you stay in control of what’s happening right now.
- Monitor key business metrics as they happen.
- Respond instantly to shifts in sales performance customer behavior or supply chain issues.
- Set up alerts to flag important changes so you’re never caught off guard.
Spotting Trends and Opportunities
Power BI helps you go beyond just seeing what’s happening. It also helps you understand why?
- Find out which products or services are trending upward.
- Catch issues early like a slow decline in customer satisfaction.
Uncover new markets or growth opportunities before your competitors do.
Improved Strategic Planning
Planning isn’t just about setting goals—it’s about using data to set the right ones.
- Analyze past performance to predict future outcomes.
- Align team goals with data-backed insights.
- Make budgeting, forecasting, and resource planning more accurate and reliable.
Case Studies of Success
Real businesses are already using Power BI to sharpen their decisions:
- Retail example: A fashion brand used Power BI to track buying trends and optimize stock. The result? Fewer shortages, less waste, and higher customer satisfaction.
- Finance example: A finance company cut costs by 15% in six months just by tracking expenses and identifying inefficiencies in real time.
- Healthcare example: A hospital system reduced patient wait times by 20% after analyzing traffic patterns and bottlenecks in care delivery.
Bottom line? Power BI takes the guesswork out of your influential decision-making. It helps you spot what’s working, what’s not, and where to go next. All from a single dashboard. So, dive deeper easily for your worthy conclusions with the confidence you need!
Busting Common Myths About Power BI
Do you know a lot of non-tech executives shy away from tools like Power BI because of myths that have made it sound harder than it really is. It’s time to clear the air.
It’s for anyone who wants to make smarter business decisions with less stress, not just for analysts or tech teams.
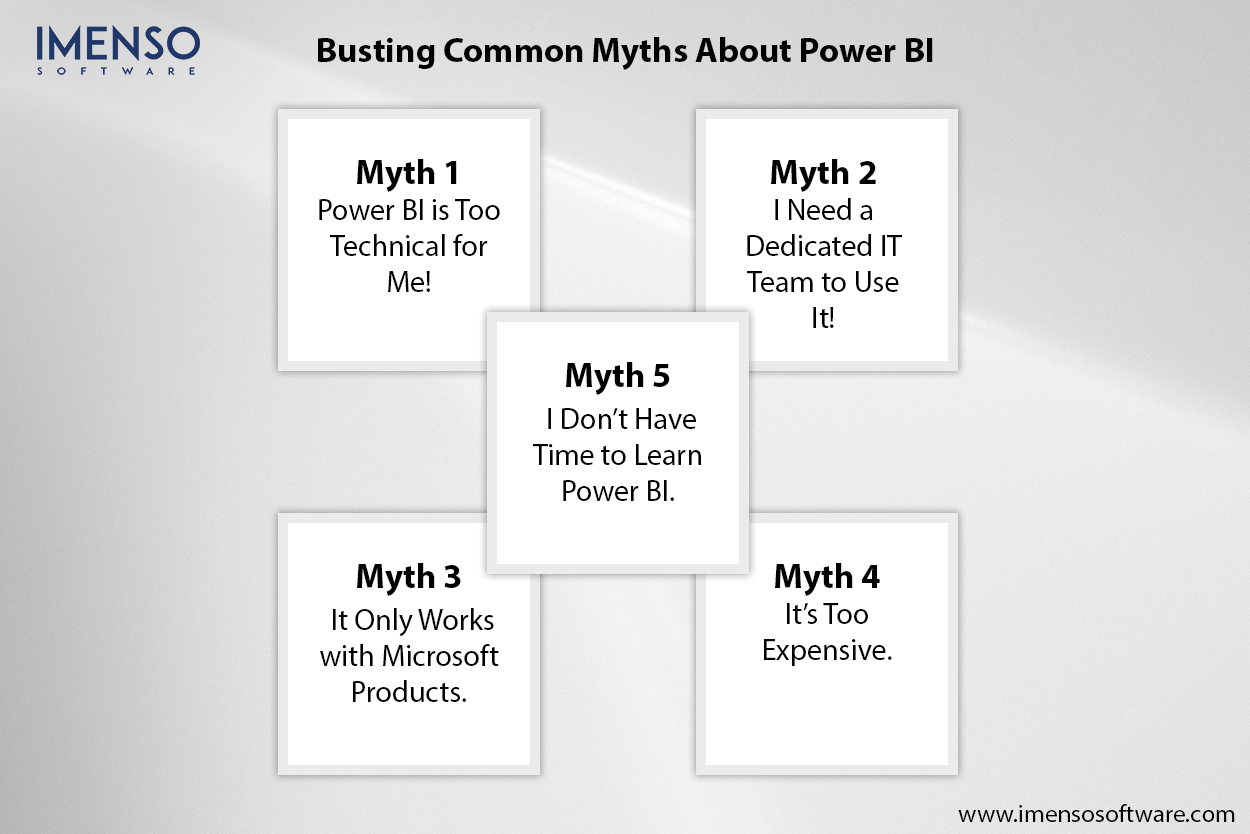
Myth 1: Power BI is Too Technical for Me!
Truth: Power BI was built with simplicity in mind.
- You don’t need to know coding or data science.
- Most tasks use drag-and-drop or natural language queries.
- If you can use Excel or PowerPoint, you can use Power BI.
Myth 2: I Need a Dedicated IT Team to Use It!
Truth: You can get started without one.
- Power BI Desktop is free to download and use.
- Many small and mid-sized business leaders build their own dashboards.
- IT teams can help scale it, but they’re not required for daily use.
Myth 3: It Only Works with Microsoft Products.
Truth: Power BI works with hundreds of data sources.
- Excel, Google Analytics, Salesforce, QuickBooks, and more.
- It can connect, whether your data is on the cloud or on your computer.
- It integrates smoothly with both Microsoft and non-Microsoft tools.
Myth 4: It’s Too Expensive.
Truth: It’s affordable for any size business.
- Power BI Desktop is free.
- Power BI Pro (for sharing and collaboration) costs less than most monthly software subscriptions.
- You get powerful features without breaking the budget.
Myth 5: I Don’t Have Time to Learn Power BI.
Truth: You don’t need hours of training to learn it
- There are tons of easy-to-follow tutorials and templates.
- Most users start creating basic dashboards within their first hour.
- Once you see how much time it saves, you’ll wonder why you waited.
Don’t let myths stop you from trying something that could seriously level up your leadership. So, once you give it a shot, you’ll see how easy and helpful it can be.
How to Make Power BI Part of Your Daily Workflow?
Using Power BI once a month won’t give you the full benefit. To really get value from it you want to make it part of how you work every day. The good news? It’s easy to weave Power BI into your routine so you’re always working with the latest insights, not yesterday’s guesses.
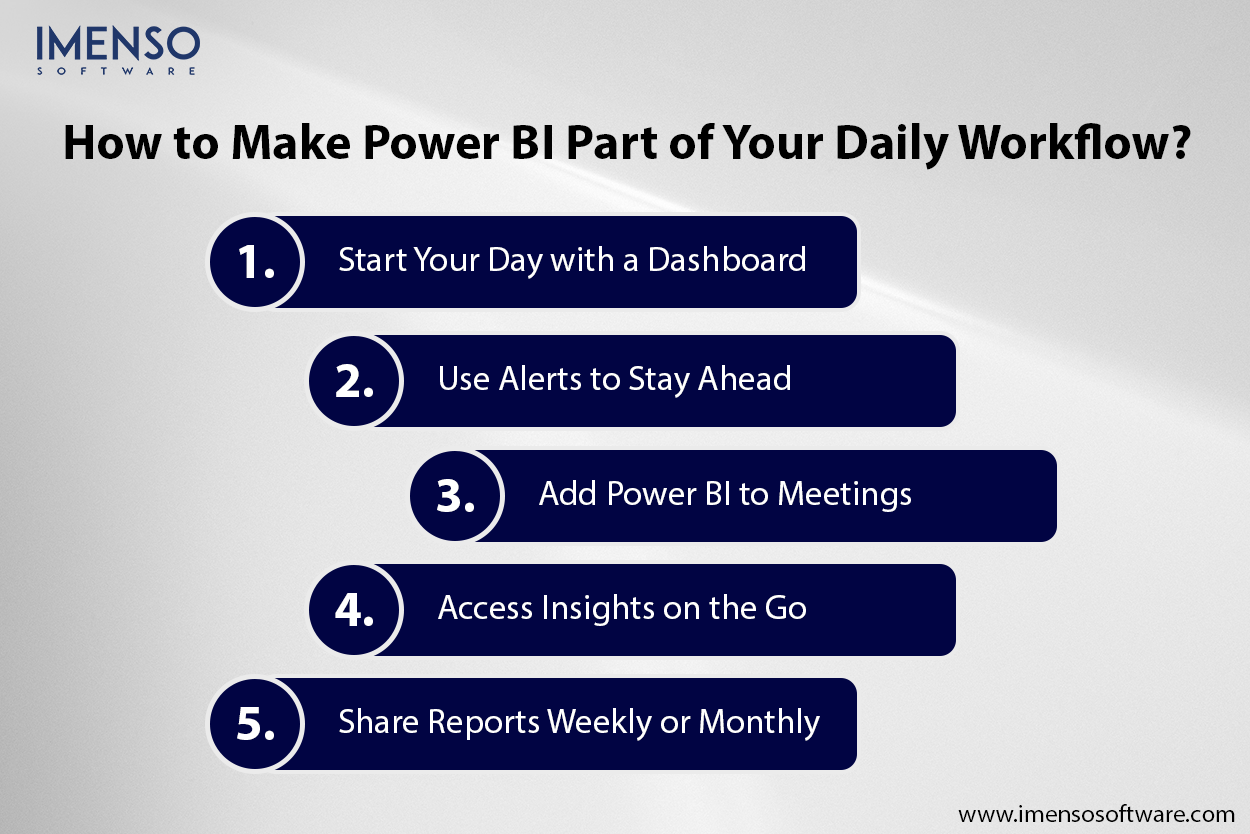
1. Start Your Day with a Dashboard
- Instead of checking your email first thing open your Power BI dashboard.
- Set up a homepage with key metrics, sales numbers, performance charts project status.
- With live data feeds, you’ll always know what’s working and what needs attention.
2. Use Alerts to Stay Ahead
- Set up automatic alerts to notify you when something hits a critical level.
- Maybe sales drop below target or inventory runs low—Power BI tells you right away.
- No need to constantly check—just get pinged when action’s needed.
3. Add Power BI to Meetings
- Bring live dashboards into team or stakeholder meetings.
- Skip the slide decks and show real-time data instead.
- This keeps discussions grounded in facts not opinions.
4. Access Insights on the Go
- Use the Power BI mobile app when you’re traveling or in the field.
Check performance data from your phone or tablet anytime anywhere. - No laptop required—just tap and go.
5. Share Reports Weekly or Monthly
- Send automatic report updates to your team.
- Schedule refreshes so everyone sees the latest numbers without doing a thing.
- Build a culture of data-driven decisions across the company.
Making Power BI part of your routine doesn’t mean adding more work—it means replacing the guesswork with real clarity. When you build habits around data you start leading with facts and confidence not assumptions. And that’s how smart decisions become second nature.
Smarter Leadership Starts with Better Data
You don’t need to be a tech wizard to lead with data. You just need the right tools—and the willingness to start. Power BI is designed for leaders like you who want to see the full picture and act with confidence without getting lost in spreadsheets.
It’s not about learning software. It’s about unlocking answers. Answers to what’s working, what’s not, and where to go next.
Here’s What We Covered:
- Power BI turns raw data into visuals you can understand at a glance.
- You can use it without writing code or hiring an IT team.
- It helps you make fast clear data-backed decisions.
- It fits into your daily routine and grows with your business.
Data isn’t just for analysts anymore. It’s for anyone who wants to lead smarter. Power BI can become your go-to tool for real-time insight. You’ll wonder how you ever ran your business without it, the moment you start using it.
What to do now?
- Download Power BI Desktop and explore a few sample dashboards.
- Pick one business challenge you’re facing, and see what the data says.
- Make Power BI a daily habit and let your decisions speak for themselves.
Smarter leadership starts with better data, and better data starts with Power BI. Now’s the time to make it work for you, so get ready!
FAQs
Q1: Do I need to know how to code to use Power BI?
Not at all required. Power BI uses simple drag-and-drop tools and natural language features, as available in your Excel or PowerPoint.
Q2: Is Power BI only for big companies?
No, Power BI scales with your business; start small and grow as needed. This is the reason, it is preferred by small and mid-sized businesses daily.
Q3: What’s the difference between Desktop and Pro?
The Desktop version is free. You can build and explore reports on your own computer. Pro is a paid version that lets you share reports with your team and work together online.
Q4: Can it work with the tools I already use?
Yes, it connects with tools like Excel, Google Analytics, Salesforce, QuickBooks, and many others. If you already use it, chances are this tool works with it too.
Q5: Is it hard to learn?
Not at all, most people create their first report in under an hour. Once you get the hang of it, using it feels as normal as checking your email.
Q6: Is my data safe?
Yes, it’s built by Microsoft and uses strong security to keep your data protected.
Q7: Can I use it on my phone?
Yes, there’s a mobile app that lets you check your data on the go, perfect before meetings or while traveling
Want more information about our services?


Similar Posts

Power BI Data Modeling Best Practices
The backbone of any strong Business Intelligence tool is data modeling. Believe it or not, many organizations have seen an increase of up to 35% in data accuracy after following proper Power BI data modeling best practices. Among the advanced tools for data visualization, Power BI can let a business unlock the full potential of […]...

Understanding Power BI Embedded Development for Seamless Data Integration
If you’ve been navigating the world of business intelligence software, the term “Power BI Embedded developer” would possibly have stumble upon your radar. These developers play a vital role in embedding Power BI reports into your company’s applications. They also integrate Power BI analytics into your existing applications. The ability to incorporate rich, interactive data […]...

9 Power-packed Tableau Techniques from Experts
Are you sick and weary of battling clumsy data for hours only to be forced to perform boring manual work and run into issues throughout your analysis? It’s time to leverage Tableau techniques to overcome these challenges. Then you are not by yourself. A lot of individuals discovered that while data preparation is the foundation […]...


