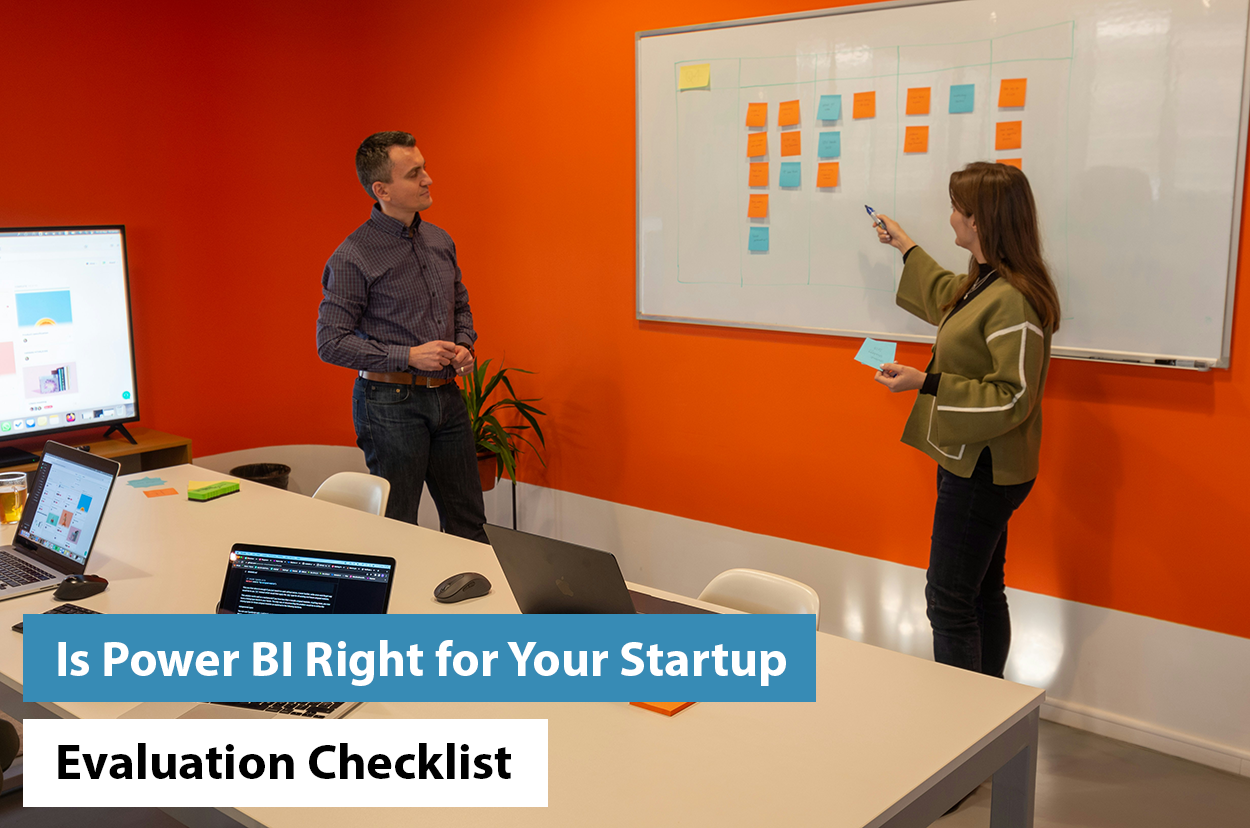
Is Power BI Right for Your Startup? Evaluation Checklist
“Information is the oil of the 21st century, and analytics is the combustion engine,” Peter Sondergaard, Gartner Research.
For a startup to succeed, it needs powerful apps. Data solutions that help it meet the expanding demands are critical for growth. Power BI is one such tool that enables startups to thrive. The business intelligence software converts data into insights.
Today, we are generating more volumes of data than ever. The same data can help you spot opportunities and set yourself up for success. But if not analyzed properly, it offers zero value.
Power BI, with its robust analysis features, helps startups make informed decisions. In a nutshell, it helps you with things like:
- Spotting trends in real time so you can capitalize on them.
- Enables the entire team to collaborate seamlessly
- Breaks down data silos that have halted your growth before.
- Gives you the gift of well-informed decision-making.
Intrigued to learn whether Power BI is right for you? This post will give you the answer.
What Is Microsoft Power BI and Why Is It Popular?
Power BI is a data visualization solution. It lets you merge, organize, and assess data. With it, you can create various data-driven reports and dashboards. Then, share the insights you acquire through them.
Power BI shines in its ability to arrange disparate data from various sources. The software makes this abstract data easy to understand. Power BI upholds self-service. It means moving access to information from professional data analysts to others. These include the end users, staff, and other decision-makers. This is the reason why startups of any size can use the tool.
Understanding Power BI’s Working With an Example
Imagine a startup with sales and marketing teams. There is also the senior staff of executives and managers. All of them can use Power BI as per their needs.
- The sales team can review the turnover and suppliers. They can run trend analysis. This allows them to uncover opportunities that they would otherwise have missed.
- The marketing team can use the tool to track the performance of their campaigns. In doing so, they can predict customer churn and run sentiment analysis.
- The senior staff can use the business intelligence solution to monitor the company’s performance. They can spot critical trends in the market and conduct what-if scenarios. This lets them make the wisest possible decisions.
What’s the Power Behind Power BI?
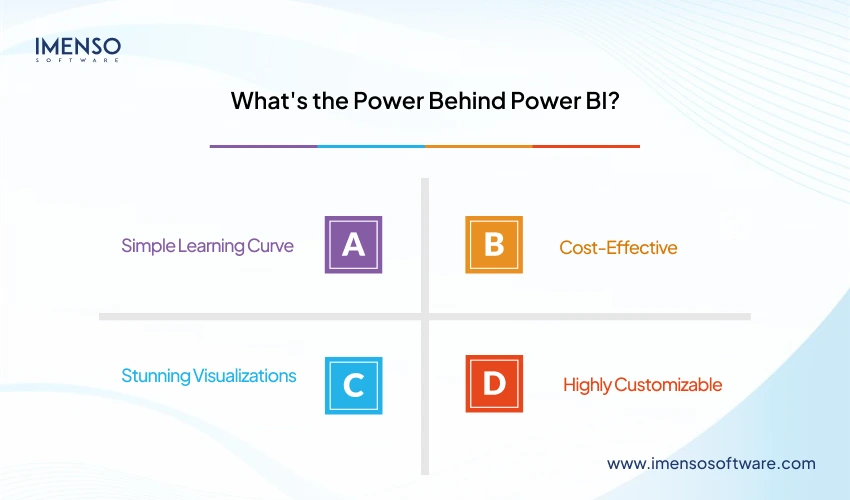
Now you know what Power BI does. Undoubtedly, it can help startups in various ways. But what makes it more popular than similar ones in the market? The answer lies in its specific features.
Simple Learning Curve
Power BI has a user-friendly interface. Even non-tech-savvy startup owners can use it to create data visuals with a few clicks.
Cost-Effective
You can purchase Power BI through various pricing plans. Both small and big businesses can benefit from its capabilities.
Stunning Visualizations
Use data storytelling and visually aesthetic displays to communicate with your clients, staff, and others.
Highly Customizable
You can customize and interact with visualizations like charts and graphs. They help you dig deeper into data. Thus, you can uncover more insights.
As of 2025, more than 54,978 companies globally have adopted Power BI as their Business Intelligence tool.
Related: Microsoft Power BI Development and Consulting Services
Evaluating Power BI for Startup Use
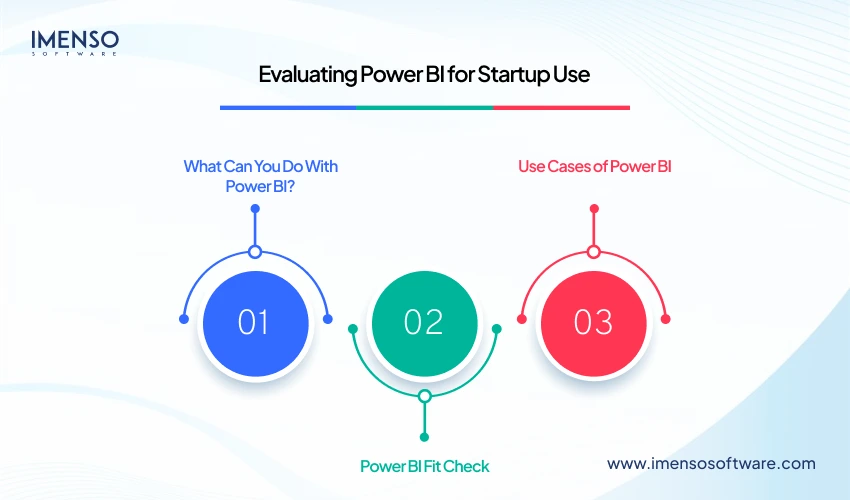
To determine if Power BI is right for your startup, you must know what you can do with it. Learning about its use cases will further help you assess whether it’s suitable for your startup.
What Can You Do With Power BI?
Connecting Data Sources
Diverse data sets hinder you from drawing data-driven insights. Power BI merges various data sets from different sources in a few seconds. Thus, you can easily spot connections across disparate sets of information. Users can link varied data sets on certain parameters. These can be anomalies, trends, or anything else. This lets you identify the following:
- Upcoming trends
- Obscured connections
- KPIs
- Areas of performance that need improvement
This knowledge is like a goldmine for every startup. It gives you a holistic view of what your end users want. You also learn where your operations are lagging and areas you can capitalize on.
Forecasting Patterns and Trends
Data hides many trends. Power BI analyses the data deeply. It lets you see past the surface of the data. For example, the sales team can assess past and future data to discover if the current sales need investment. Power BI tells you about the expanding or reducing popularity of any product. With this information at hand, you can make strategic changes.
Facilitating Collaborations
Collaborations between startups stimulate new ideas. Power BI enables real-time collaboration. This, in turn, leads to mutually beneficial relationships. Power BI aids collaboration with limited access. It also allows you to share your data insights with another company. You can monitor collaborative success with real-time insights.
Supporting In-House Collaboration
Besides external, Power BI also aids with collaboration across teams in a startup. Departments in any company operate in isolation from one another. This increases the chances of data silos. Power BI combines data from, say, an HR department, which helps uncover critical things. It helps with finding out employee churn and other crucial insights. Power BI, when used with Microsoft Teams, aids cross-team collaboration with ease.
Setting and Monitoring KPIs
KPIs measure your startup’s performance. They are analytically informed. It’s critical to observe them over a definite period. Power BI makes this possible. It shows you a clear visualization of your current results. The tool holds your results against industry trends. So, you can set the right KPIs as per your needs. You can quickly update Power BI visualizations in real time. They can be narrowed down based on certain questions. So, Power BI allows full monitoring of your KPI results.
Managing Promotions
High-demand promotions are an intense period in any startup. It uses data sets from prior promotions. This allows it to forecast demand changes. It is also able to spot bestsellers. If you regularly feed promotion data into the tool, it becomes easy to monitor all changes in sales. Thus, you can adjust your marketing tactics and benefit from better outcomes.
Use Cases of Power BI
Understanding the use cases of Power BI will help you see if it aligns with your needs. Here’s how the tool is practically used.
Resource Management
Power BI has strong visualization capabilities. It’s used to make better decisions about task and resource allotment. Startups use “Power Pivot” and “Power Query” to create reports. It lets you track the major KPIs like task count, open projects, and more. Power BI is used in manufacturing, with various production facilities.
Sales Scorecard
It’s critical to learn the performance of each salesperson. This determines the success of the broader initiative. Power BI creates a separate sales report. You can review them to monitor the team’s performance. The tool creates slide and dice reports. These are reviewed based on the team’s performance and products.
Financial Reporting and Analytics
A financial reporting dashboard in Power BI helps you grasp complex figures. It gives you a clear view of your expenses and revenue streams. Thus, you can make better decisions about cash flow.
Claims, Billing, and Collection Report
Power BI creates tailored dashboards and data summaries. This helps you assess claim data. The real-time view of the reports lets the claim processing team communicate with the team. They can then review the results. The insights from data analysis create a fluid experience for customers and staff.
Supply Chain and Inventory Management
You can integrate Power BI with supply chain operations. This lets you leverage the monitoring and optimization of inventory levels. It provides smart dashboards for visualizing inventory levels. The tool does demand and supply analysis that enhances decision-making. The real-time insights help operational teams spot issues. They can monitor supplier performance for efficient supply chains.
Customer Segmentation
You may have an idea of your target market. But you may not have the data to position your product in the best way. Power BI gives you a deep understanding of your customer segment. It does this by assessing the behavior in certain groups. The customer segmentation dashboard lets you prioritize new products. At the same time, you can also focus on customers interested in your offerings.
Project Performance Tracking
Power BI has many project management tools. Those like Trello and Microsoft Project track key milestones. Managers can get real-time data about the project status. A centralized dashboard contains metrics for project success. This allows managers to spot potential risks. It leads to better budget allocation across projects.
Customer Service Analytics
Quality customer service is critical for customer satisfaction. Power BI has customer service analytics dashboards. Startups can use these for many aspects of customer service. Metrics like customer feedback scores and satisfaction scores help address service gaps timely manner.
Student Performance Tracking
Schools use Power BI to assess the performance of students. It can also determine enrollment trends. Schools use it to track attendance and learning curves as well. This helps them find out the level of attention that students receive to achieve better outcomes. Power BI helps teachers spot students with low productivity. They can then employ the right strategy to boost student success.
Power BI Fit Check
Finally, we will go over some basic factors to consider. Here’s a quick checklist to determine if your startup needs the tool.
Data Complexity
Do you need to analyze data from many diverse sources? Power BI excels in linking various data sources.
Data Volume
Does your startup deal with huge datasets? It’s not a good idea to manage them in Excel. Power BI will be a better choice.
Data Transformation
Do you require data cleaning and transformation before analysis? Power BI has tools like Power Query for this purpose.
Predictive Analysis
Does your startup perform advanced analysis? It may predict future trends as well. Power BI’s built-in analytics and ML features help with this.
Current IT Infrastructure
Does Power BI integrate well with your current IT infrastructure? The tool can link to many platforms. But you need to verify this beforehand.
Self-Service BI
Do you want your users to access data and generate their own reports? Power BI’s self-service approach to BI lets users explore and visualize data.
Learning Curve
Power BI is not overly complex. But you still need some initial training.
Cost
The cost of Power BI includes licenses and potential consulting. You must ascertain whether you can bear these expenses.
Security and Compliance
Power BI has many security features. But you need to find out if they align with your needs.
Reporting and Dashboards
The tool is replete with various reporting and dashboard abilities. Assess whether they are aligned with your startup needs.
Transform Your Startup With Data-Driven Insights
Using Power BI in your workflows can change how you handle data. It drives greater efficiency for your startup. With advanced features and ease of use, Power BI is a leading business intelligence software.
Hopefully, you now have a good idea of how it can benefit your business. If you think it’s the right tool for your startup, waste no time in getting started with it today.
To best realize the visualization as per your needs, consider hiring a consultant. They will help you leverage big data seamlessly with smart analytical tools. Thus, you’ll become a data-driven startup positioned for growth.
Useful: Choosing the Ideal Microsoft Power BI Partner for Your Business
Frequently Asked Questions
Is Power BI good for predictive analytics?
Yes, Power BI uses its built-in analytics and ML abilities. You can create predictive models by using past data. This lets you forecast future events.
Is Power BI beginner-friendly?
Power BI has a small learning curve. If you invest a bit of your time daily, it’s easy to master the tool. Microsoft also offers many resources for learning Power BI.
Is Power BI better than Google Analytics?
Power BI is best for creating simple and complex reports. Google Analytics has strong web reporting features. Which one is better for you depends on your unique needs.
Can we use Power BI for ETL?
Yes, the Power BI dashboard has many ETL features. These are part of the Microsoft products, like the Azure Data Lake Storage. It is perfect for ETL of large data volumes at scale.
Want more information about our services?


Similar Posts

Power BI Professional Services: Elevating Your Business Intelligence Strategy
Businesses today are flooded with data. This data must be transformed into actionable insights to stay competitive. A retail business can examine the purchasing habits of its customers. Inventory optimization is possible with this information. It can also be used to tailor marketing efforts effectively. It can also be used to tailor marketing efforts effectively. […]...

How to Integrate Power BI with Web Applications: A Simple Guide
Power BI has become a leading business intelligence tool, transforming data into interactive insights. Many companies today want to integrate Power BI with web applications to gain real-time access to critical reports and dashboards. Doing this enhances the user experience by embedding live data into your application. In this guide, we’ll discover the way to […]...
Why Data Analytics Solutions Should Be The New Trend SMBs Catch Up On
Here is an interesting fact – today, humans produce 2.5 quintillion bytes of data every day. How much do you think it is? It’s 2.5, followed by 18 zeros! Mind-bending right?...


