How to Create a Data Culture in Your Organization Using Power BI?

Without data, you’re just another person with an opinion. ~W. Edwards Deming
Do you believe that decisions backed by real-time insights are no longer an option? Organizations that invest in building a data culture gain a competitive edge. Also, it improves efficiency and fosters innovation across departments.
But creating a data-driven culture needs more than deploying dashboards. The entire team has to work with different mindsets and break the silos. These are important to access and interpret data effectively.
Microsoft Power BI is critical in connecting data sources and building custom dashboards. It helps to generate actionable-insights and transform decisions across the board.
Let’s break down and explore how Microsoft Power BI helps organizations move from scattered data to strategic clarity.
What is a Data Culture and Why It’s Crucial Today?
A data culture is an organizational mindset. Here, decisions are not based on facts and not assumptions. This also refers to when every individual in an organization has access to real-time data. Also, they should be trained to manage it effectively.
The data-driven culture is very strong. It’s embedded in daily operations of businesses. In fact, it makes employees feel confident to make better decisions faster.
Organizations that build a data culture improve operational efficiency by up to 20%. This helps to make strategic decisions faster.
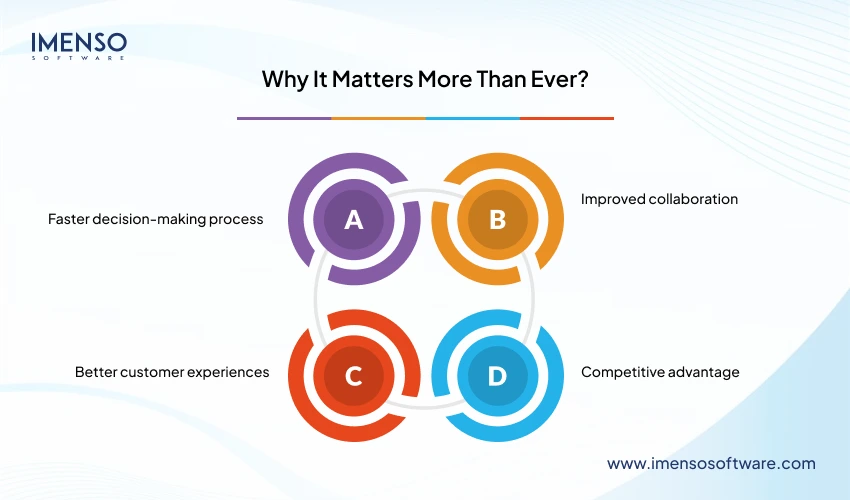
Why It Matters More Than Ever?
Still figuring out if data culture is helpful to your business? Let’s explore why it could be helpful to your business.
Faster decision-making process:-
Teams can act quickly if they have access to real-time data from Power BI dashboards.
Improved collaboration:-
Departments align more easily when data is transparent and updated.
Better customer experiences:-
Insights from a Power BI application can guide personalization. This reduces churn rate and improves service.
Competitive advantage:-
Companies with an established analytics culture can adapt faster to change and dynamic market demands.
Ultimately, building a data analytics culture helps turn raw numbers into meaningful actions. That’s what drives sustainable growth.
The Role of Power BI in Building a Data-Driven Organization
Do you know the real challenge in today’s world isn’t collecting data? It’s knowing what to do with it. Many organizations sit on piles of valuable information and struggle to convert it into actionable insights. That’s where Microsoft Power BI plays a game-changing role.
Instead of letting reports collect dust in someone’s inbox, Power BI dashboards bring data to life. It makes them work visually, interactively, and in real time.
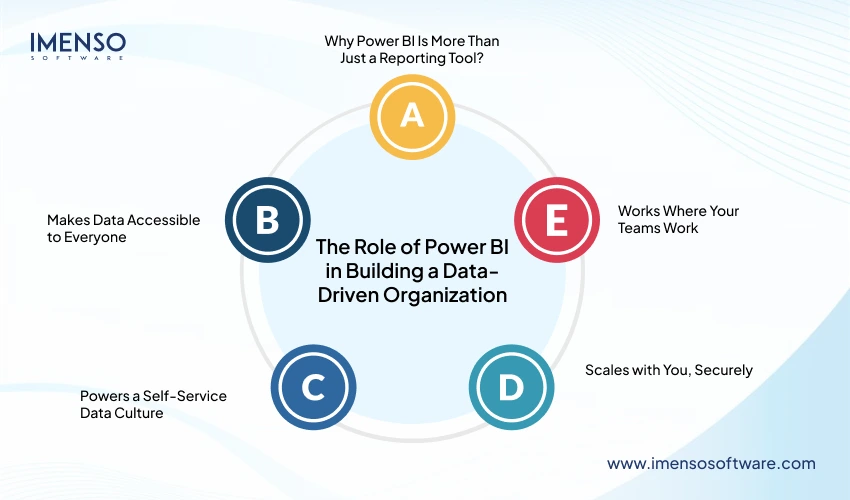
Why Power BI Is More Than Just a Reporting Tool?
Think of Power BI as your organization’s central nervous system for data. It’s not just software; it’s a cultural enabler.
Makes Data Accessible to Everyone
You don’t need to be a data analyst to use Power BI. Employees in any department can use it with drag-and-drop dashboards and easy filtering tools. They can explore trends and spot issues instantly.
Powers a Self-Service Data Culture
Gone are the days of waiting for weekly reports. Team members can create their visualizations and make quick and informed decisions with Power BI.
Works Where Your Teams Work
The Microsoft BI ecosystem integrates with Power BI and tools that your teams already use. It involves Excel, Teams, and Outlook. That means insights can appear during a Zoom call, inside a spreadsheet, or in a project chat. No disruption, just clarity.
Scales with You, Securely
Whether you’re a startup or a global enterprise, Power BI adapts. Its built-in security features help you protect sensitive data while still giving teams the access they need to stay agile and aligned.
Steps to Building a Data-Driven Culture Using Power BI
Creating a data-driven culture isn’t something that would happen overnight. It’s an entire step-by-step journey that combines mindset and tools. Additionally, it requires consistent efforts.
Here’s how you can lead that transformation using Microsoft Power BI:
Start with Leadership Commitment
Building a data culture starts at the top. Leaders must actively use Power BI dashboards. Besides this, they can ask data-backed questions and make analytics part of strategy conversations. When executives set the tone, others follow.
| Tip: Encourage leadership to showcase decisions driven by Power BI visual reports in company-wide meetings. |
Define Clear Data Goals
What business problems are you solving with data? Focus on reducing churn, tracking inventory, or improving customer experience. Define your KPIs and ensure Power BI is aligned with those objectives.
| TipAligning goals across teams to build a unified analytics culture. |
Make Power BI Accessible to Everyone
Empower every department to explore data. Train non-technical staff on how to use Power BI applications for daily decisions. Use role-based dashboards to show only the data that matters to each team.
| Tip:Use the Power BI service to share dashboards securely and in real time. |
Integrate Power BI Into Daily Workflows
Don’t treat data analysis as a separate task. Embed Power BI into tools people already use, like Teams, Outlook, and Excel. The easier it is to access insights, when more people will use them.
Celebrate Small Wins
Highlight success stories, like how marketing improved ROI or HR reduced turnover using Power BI. Celebrating outcomes builds trust and encourages wider adoption. Also, storytelling makes data culture stick.
Invest in Ongoing Data Literacy
A long-term data analytics culture needs continuous learning. Offer Power BI workshops, share video tutorials, and encourage curiosity about data. Empowering employees helps them to grow beyond reading dashboards, letting them explore and act.
Related: Choose Microsoft Power BI Partner for Your Business
Real-Life Case Studies: Power BI in Action
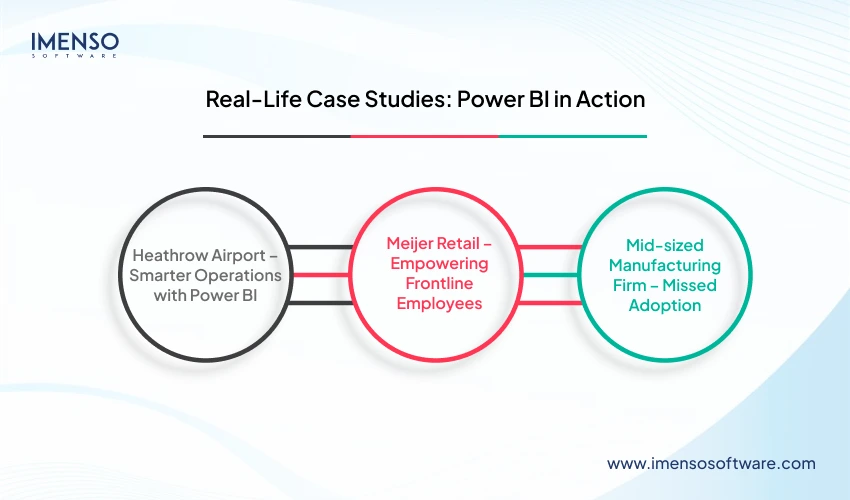
Heathrow Airport – Smarter Operations with Power BI
The Challenge:
Heathrow Airport needed to manage vast amounts of operational data, from security wait times to passenger flow. Also, had trouble turning it into real-time insights.
The Solution:
Using Microsoft Power BI, Heathrow built dynamic dashboards that allowed ground teams, management, and support units to monitor live performance metrics. The airport responded faster and more efficiently by visualizing bottlenecks and delays.
Results:
- Real-time operational decisions
- Improved passenger experience
- Stronger cross-department communication
Conlcusion: Complex operations become more agile when data is visible and timely. This is the impact of embedding Power BI into everyday workflows.
Meijer Retail – Empowering Frontline Employees
The Challenge:
Meijer, a large U.S. retailer, struggled with giving store managers access to actionable inventory and sales data without involving IT constantly.
The Solution:
Meijer deployed Power BI applications to deliver real-time and role-specific dashboards. Store managers now track shelf performance, predict restocks, and identify trends without technical help.
Results:
- Reduced out-of-stock rates
- Faster local decisions
- Increased employee confidence with data
Conclusion: A self-service analytics model empowers non-technical users, strengthening the overall data culture.
Mid-sized Manufacturing Firm – Missed Adoption
The Challenge:
The company invested in Power BI but didn’t train teams or align analytics with daily work. Data stayed within the analytics team and reports were rarely used.
The Outcome:
Decisions continued to be made based on instincts despite having a powerful BI tool. Eventually, leadership questioned the ROI and scaled back the Power BI rollout.
Conclusion: Simply adopting tools isn’t enough. It is importat to buy-in, training, and integration into workflows. In the absence, even top-tier platforms fail to build a data-driven culture.
A Unique Strategy: The “Data Culture Circle” Framework Using Power BI
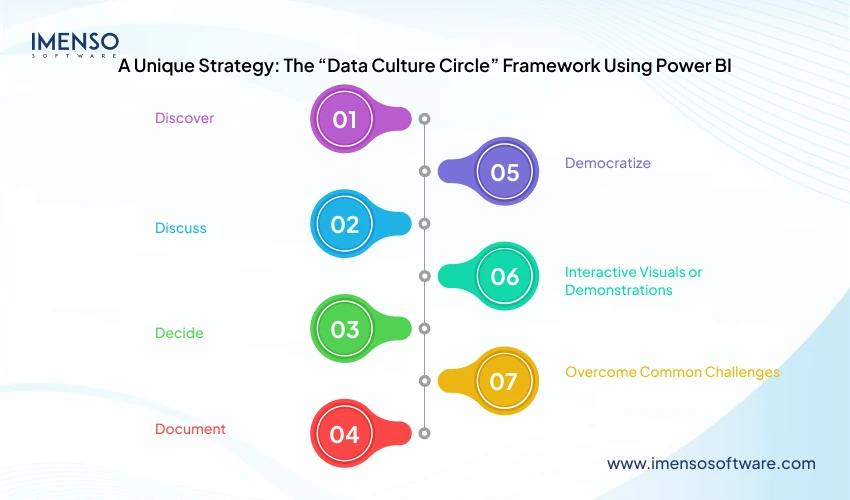
Most guides focus on tools or training, but they miss the human behavior loop. So here’s a strategy we call the Data Culture Circle. It’s a continuous 5-step loop that blends Power BI, team engagement, and business outcomes.
Think of it like a fitness tracker for your company’s data mindset. It keeps everyone moving forward every day.
Discover
Start by surfacing data from all departments using Power BI dashboards. Don’t just look at the big stuf, include micro-metrics that matter to daily work (like email response times or task bottlenecks).
Tool to use: Power BI’s data connectors to unify cloud and on-premises data sources.
Discuss
Turn insights into conversations. Add Power BI dashboards to Microsoft Teams or weekly meetings. Encourage teams to ask: What’s this data telling us? What’s surprising? What should we act on?
| Pro tip: Assign a “data spotlight” moment in every team sync. |
Decide
Encourage teams to document small decisions they made based on Power BI data. Such as; switching ad spend, rescheduling a shipment, or offering a discount.
| Tip:Create a culture where data isn’t just shown—it’s used. |
Document
Use Microsoft tools (like OneNote, SharePoint, or even a Power BI comments section) to log what data led to what outcome. Over time, this builds your analytics culture memory.
Start a “Data Wins” log: A lightweight archive of data-driven success stories.
Democratize
Highlight these wins publicly. Showcase “Data Hero of the Month,” share bite-sized dashboards across departments, and celebrate employees who used Power BI in creative ways.Turn data use into a badge of honor, this encourages adoption faster than training alone.
This loop reinforces itself. Every cycle builds stronger habits, smarter teams, and a deeply rooted data culture powered by tools like Microsoft Power BI.
Interactive Visuals or Demonstrations
Including a few interactive Power BI examples (or images/screenshots) would allow readers to see exactly how Power BI dashboards and reports work. If possible, even an embedded demo (like a clickable Power BI sample report) would significantly engage the audience.
Overcome Common Challenges
While you’ve touched on the benefits and steps, adding a section on common pitfalls and how to overcome them would be valuable. For example, issues like data quality, employee resistance to change, or the challenge of keeping data, relevant as the business grows.
Also Read: How Power BI is Transforming Business Intelligence in 2025?
Tricks to Tackle Challenges in Building a Data-Driven Culture
Data Overload
Teams might get overwhelmed with so much data available. Keep dashboards clean, relevant, and focused on key metrics to avoid decision fatigue.
Resistance to Change
Some employees may resist moving from gut-feeling decisions to data-driven approaches. Overcome this by showing real-world examples of data improving outcomes and providing ongoing training.
Data Quality Issues
Garbage in, garbage out. Ensure your data sources are reliable and clean. Consider setting up regular audits of your data to ensure it’s accurate and current.
Real-World Tools and Integrations
You could also highlight how Power BI integrates with other software, such as CRM systems (like Salesforce), ERP tools, and even custom applications. Showing how Power BI works in tandem with existing tools gives your audience an understanding of how to extend its capabilities within their ecosystem.
Future Trends in Data Culture and Power BI
Let’s briefly discuss upcoming trends like AI-powered insights or automated analytics with Power BI could position your content as forward-thinking.
The Future of Data Culture with Power BI
As AI and machine learning continue to evolve, Power BI is integrating more advanced analytics features. Look for:
AI-driven data insights: Power BI will begin making recommendations based on historical trends, helping users make predictions.
Voice and chat analytics: You’ll soon be able to ask Power BI questions in natural language, making data even more accessible.
Embedded analytics: The ability to integrate Power BI reports directly into other apps or customer-facing platforms, offering tailored insights wherever you need them.
Success Metrics to Track Data Culture Progress
Adding a set of measurable KPIs for tracking how well your organization is adopting a data-driven culture can help readers gauge success. Look for signs such as:
- Employee adoption rates of Power BI tools
- Improvement in decision-making speed
- Revenue or cost-saving results directly linked to data-backed decisions
- Employee satisfaction with data accessibility
For Measuring the Success of Your Data Culture
How do you know if your data culture is thriving? Here are a few key performance indicators (KPIs) to track:
- Power BI usage rate: How often are dashboards being accessed by employees?
- Decision-making speed: Are your teams making faster, more informed decisions thanks to accessible data?
- Business impact: Look at metrics like increased revenue, reduced costs, or improved customer satisfaction that can be attributed to data-driven decisions.
Build a Data-Driven Culture That Lasts
Well, creating a data-driven culture isn’t merely a tech upgrade. It is a mindset shift, i.e., moving from gut feeling to data-backed decision. Microsoft Power BI is a bridge between your data and your business goals.
It makes analytics simple, actionable, and part of your daily workflow. You can combine smart habits like Data Culture Circle to shape a future-ready organization. Culture flows when data becomes conversation. So, whether you are just starting or scaling up your efforts, you need to be consistent. With the right plan of action with Power BI, it becomes easy to build a data analytics culture, which is powerful too!
FAQs
What is a data-driven culture?
A data-driven culture means your organization uses data and not assumptions to make everyday decisions. So, your team relies on facts, not guesswork.
Why is Power BI important for building a data culture?
Microsoft Power BI makes it easy for everyone—from executives to frontline workers—to access, understand, and use data. It helps turn data into clear visual insights, fueling smarter decisions across departments.
Is Power BI only for large companies?
No! Power BI works for startups, small businesses, and global enterprises alike. Its flexibility and pricing options make it accessible for teams of all sizes.
How do I get employees to actually use Power BI?
Train teams, embed dashboards in daily tools like Microsoft Teams, and celebrate real wins. Use strategies like the Data Culture Circle to make data usage a natural part of work.
Useful: Hire Dedicated Offshore Power BI Consultants
What’s the biggest mistake companies make with Power BI?
They install it… and stop there. Without training, alignment, and storytelling, Power BI can become just another tool. Successful companies treat it as a culture enabler, not just a reporting platform.
Want more information about our services?


Similar Posts

Power BI for the Enterprise: A Complete Guide to Business Success
As businesses flow at a rapid tempo these days, data is king. Companies are constantly on the watchout for ways to higher understanding of their operations, clients, and the market. This is the area where Power BI for the Enterprise comes in. We can say it’s not only visualizing data; it makes a complete platform […]...

A Practical Guide to Data Visualization with Power BI
Are you struggling to make sense of the overwhelming volume of data at your fingertips? Are static spreadsheets and dull charts leaving you yearning for a more impactful way to visualize your insights? Look no further! In this data-driven age, unleashing the power of data visualization has become a game-changer for businesses seeking to make […]...

Explore Our Microsoft Power BI Support Services
Imagine a crystal-clear lens in a world swamped with data, and it turns those raw numbers into actionable insights, all at the click of a button. That is Microsoft Power BI in a nutshell. With the right support, it’s going to rev up your business decisions. Welcome to the future of data analytics with Microsoft […]...


