How Power BI is Transforming Business Intelligence in 2025?

“Numbers have an important story to tell. They rely on you to give them a clear & convincing voice.” ~ Stephen Few
Ever wish your business numbers could just talk to you? In 2025, they can, all thanks to Power BI.
What if instead of messy spreadsheets and guesswork, you get crystal-clear dashboards? That’s the magic of Microsoft Power BI, a powerful tool. It is changing how companies make decisions.
Over 97% of Fortune 500 companies are using Power BI dashboards to make smarter moves, faster. Even smaller businesses love it as it turns complex data into visual charts, graphs, and reports.
And here’s the kicker: businesses using Power BI say they’ve cut costs by up to 25%. All of this is possible by comprehending their numbers better.
This isn’t just business intelligence. It’s power business intelligence.
Ready to see how it works? Let’s dive in!
What Is Power BI & Why Is Everyone Using It?
Power BI is more than just a buzzword. It’s the brain behind smart business decisions. This Microsoft Power BI platform helps you see what’s working, what’s not, and what to do next, all through beautiful charts, dashboards, and real-time reports.
Microsoft created the Power Business Intelligence tool to turn boring spreadsheets into clear, interactive visuals. Instead of guessing what’s in your business, you can see it instantly with Power BI dashboards.
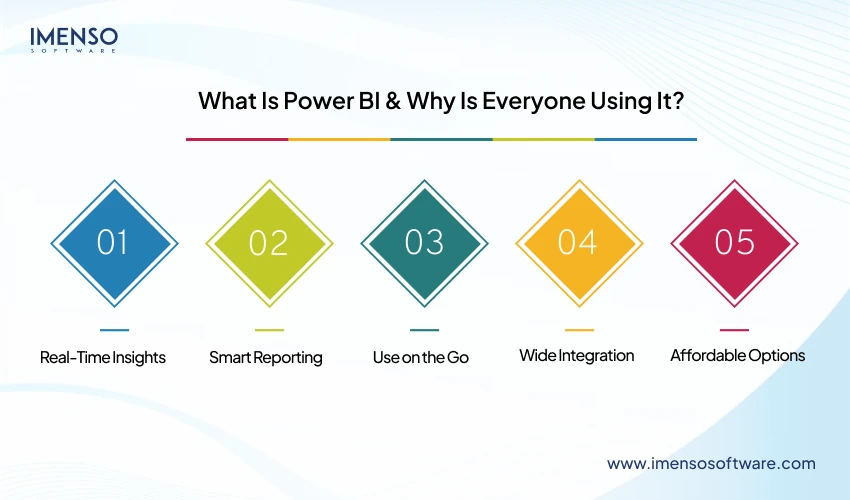
Here’s Why Power BI Is Booming in 2025:-
Real-Time Insights: With the Power BI service, businesses no longer wait for end-of-month reports. Data updates live, minute-by-minute.
Smart Reporting: Power BI reporting makes it simple to understand trends, customer behavior, and sales drops, even if you’re not a data expert.
Use on the Go: With the Power BI app, you can access your dashboard from a phone or tablet. Whether you’re in a meeting or on a plane, your data goes with you.
Wide Integration: It connects to over 100 tools, including Excel, Google Analytics, Shopify, and Salesforce. That means no more switching between platforms.
Affordable Options: Curious about Power BI pricing? It starts free, with affordable Pro and Premium tiers, perfect for both small businesses and large enterprises.
Real-World Power Moves: How Businesses Use Power BI in 2025?
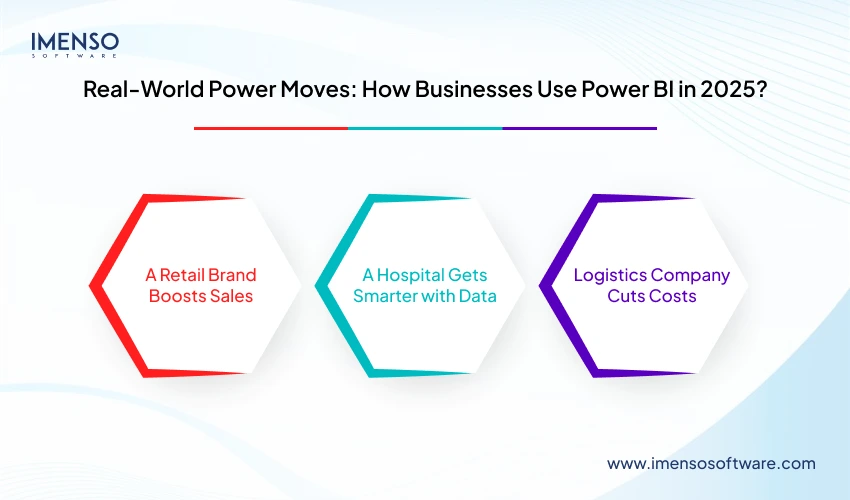
Companies aren’t just talking about Power BI. They’re using it to solve real problems. From tracking sales to spotting delivery delays, Microsoft Power BI is changing the game for businesses big and small.
A Retail Brand Boosts Sales
A fashion store using Power BI dashboards noticed a sudden drop in weekend sales. With just a few clicks, their team spotted the problem. It was delayed shipments from one warehouse.
What Does Power BI Do?
- Showed sales by location in real-time.
- Highlighted delayed shipping zones.
- Helped managers reroute stock.
The result: Sales bounced back 20% in just 2 weeks!
A Hospital Gets Smarter with Data
A major hospital used Power BI applications to track patient wait times, staff availability, and emergency room trends.
What Does Power BI Help Them Do?
- Predict busy hours using old data.
- Assign staff better based on real needs.
- Reduce wait times by over 30%.
Logistics Company Cuts Costs
One global shipping company plugged its systems into the Power BI service to track delivery delays and truck usage.
What did they gain?
- Live delivery tracking.
- Alerts for late shipments.
- Reports comparing fuel usage and routes.
This saved them over $500,000 in costs last year alone!
Top Features Making Power BI a Business Superpower in 2025
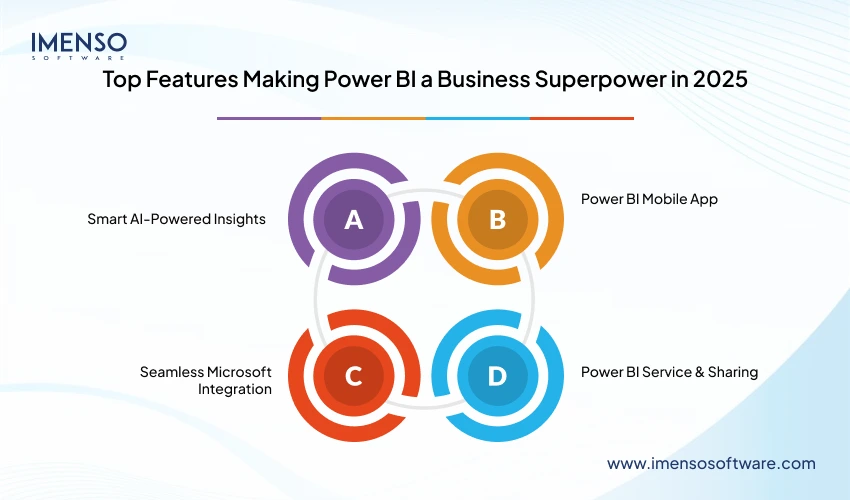
So, how exactly is Microsoft Power BI helping businesses shine in 2025? It’s not just about charts and graphs. The real magic lies in how smart and connected everything is.
Smart AI-Powered Insights
Think of this like having a data detective in your team. The Power BI app now uses AI to:
- Predict trends before they happen.
- Find patterns even your top analysts might miss.
- Give advice—yes, real-suggestions based on data.
Example: A grocery store saw Power BI warn them about an upcoming drop in soda sales based on last year’s weather and events. They cut orders just in time, no waste!
Power BI Mobile App
Need data on the go? The Power BI application works great on your phone or tablet. You can:
- Check live Power BI dashboards.
- Get alerts if something’s off.
- Share visuals with your team in seconds.
Whether you’re in the office or on vacation, your business numbers go with you.
Seamless Microsoft Integration
Since it’s part of the Microsoft Power Business Intelligence suite, it clicks easily with:
- Excel
- Teams
- Azure
- SharePoint
That means no need to switch tools—everything just works together.
Power BI Service & Sharing
With the Power BI service, you can:
- Publish reports online.
- Set who can see what (great for privacy).
- Update dashboards in real-time for everyone.
This makes teamwork way easier, especially for remote teams.
| Fun Fact Over 85% of Fortune 500 companies now use Microsoft Power BI. |
Power BI Pricing: Get More for Less
When selecting tools for your business, pricing is always a key factor. But don’t worry, Power BI has options for everyone, whether you’re a solo entrepreneur or part of a large corporation.
Let’s check out the pricing breakdown:
| Plan | Cost | Key Features |
| Power BI Free | $0 | Create reports and dashboards
Visualize data from Excel or other sources- Basic features only |
| Power BI Pro | $10 per user/month | Share and collaborate in real-time- Access hourly data refreshes- Advanced report features |
| Power BI Premium | $20 per user/month (or capacity-based pricing) | Advanced data storage and processing- Faster data refresh rates- AI features and security |
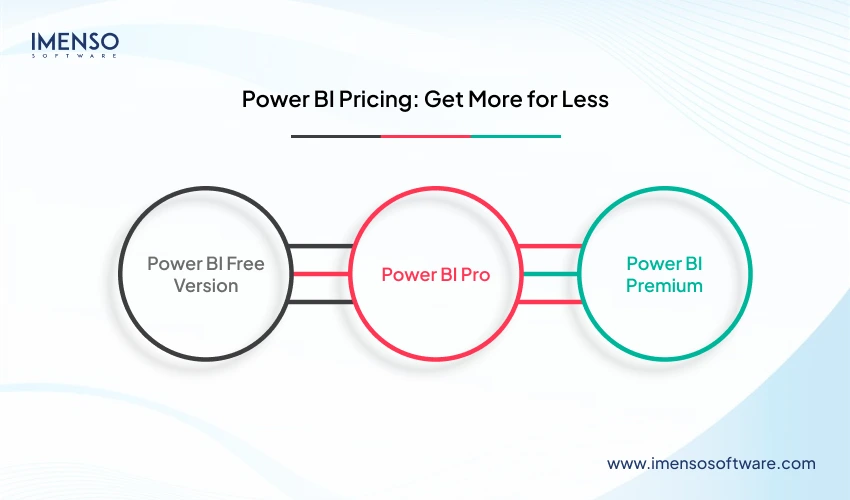
Power BI Free Version
The Power BI Free version is perfect for individual users or those testing the waters. You can:
- Create basic reports.
- Visualize data from Excel and a few other sources.
- Explore Power BI without spending a penny.
If you’re just getting started, this free version is a great way to see if Power BI works for you.
Power BI Pro
If you need to collaborate with your team and share reports, Power BI Pro is the next step. At $10 per user/month, this plan offers:
- Real-time dashboard sharing with your team.
- Hourly data refreshes for the latest info.
- More advanced features for better insights and decision-making.
Perfect for growing teams who want to harness data together!
Power BI Premium
For large companies with complex needs, Power BI Premium is the way to go. Starting at $20 per user/month (or based on capacity pricing), it offers:
- Massive data storage and faster refresh rates.
- Advanced AI and analytics features.
- Better security for handling sensitive information.
- On-premises reporting for large-scale businesses.
If your company handles huge datasets and needs advanced features, this is the plan for you.
| 💡 Pro Tip Start with the free version to explore Power BI. You can move to Pro or Premium, depending on your business needs. |
Know Your Data Like Never Before With Power BI Dashboard
Do you know data visualization plays a key role in decision-making? That’s where Power BI dashboards shine. A single dashboard is like a snapshot of all your data. So, you can see trends, patterns, and key metrics.
Here’s why Power BI dashboards are a game changer:
Real-Time Updates: Power BI dashboards are always updated. It is because they pull live data from multiple sources.
Customizable Views: Tailor your dashboards to match exactly what you want to see.
Interactive Reports: Want to explore deeper? Just click on any chart or graph to instantly dive into the details behind the numbers.
| Do You Know? 🤔 Businesses that use Power BI for data visualization see a 28% increase in decision-making speed. |
Turn Raw Data Into Actionable Insight With Power BI Reporting
The Power BI reporting is a serious next-level thing. It allows users to create interactive visuals without needing technical skills.
Features:-
- Ease of Use: Even beginners can easily create comprehensive reports by using it.
- Customizable Visuals: Choose from numerous data formats available, which are best-suited for your business.
- Automated Report Distribution: Power BI allows you to automate the distribution of reports. It ensures that everyone gets the information they need.
Take Your Data Everywhere With Power BI App
Today, we need access to our data at all times. And that’s where the Power BI app helps. It keeps you connected to your data. So, you monitor key metrics and make informed decisions anytime, anywhere.
Power BI App Highlights:
- Cross-Device Compatibility: View the reports on different devices easily.
- Push Notifications: Get instant alerts for important changes in your data.
- Offline Access: You can view cached reports and dashboards even in the absence of an internet connection.
| Interesting Fact
The mobile BI adoption has increased by over 40% year-over-year, with the Power BI app leading the charge. |
Get More Value from Power BI Without Breaking the Bank
Let’s talk money. One of the best things about Power BI is its pricing. It’s built to fit all kinds of businesses, from solo users to big companies.
Power BI Plans at a Glance:-
Power BI Free
Perfect, if you’re just starting. You can create reports and explore your data without paying anything.
Power BI Pro
Great for teams. You can share reports, work together, and use more advanced tools.
Power BI Premium
Best for large companies. It gives you more power, faster performance, and deeper insights.
The Power BI pricing grows with your business. You get the tools you need when you need them.
Why Power BI Will Stay Ahead in 2025?
Power BI is not slowing down. In 2025, it will remain one of the top tools for business intelligence. It keeps growing with smarter AI, better machine learning, and stronger data tools.
What’s Coming in 2025 in the Power BI?
Smarter Insights:
Power BI will use AI and machine learning to give deeper, more accurate suggestions.
AR Features:
It may bring augmented reality tools for a more hands-on look at data.
More Connections:
Power BI will likely work with more apps and platforms, so more people can use it easily.
The Ultimate Super-Power for Your Business Growth
Power BI is a secret weapon for your business. It has the potential to turn that mountain of numbers into simple and actionable insights. Just having a GPS for your business, guiding you to success while keeping you ahead of potential pitfalls.
The best part? Power BI dashboards keep all your data in one place, making it easy to monitor everything in real-time. And with the Power BI service, you can access your insights from anywhere, even while on the go. It’s not just a tool; it’s the ultimate game-changer.
FAQs
How is Power BI useful?
Power BI is a tool from Microsoft that helps you turn data into cool visuals. It helps you make better decisions by showing what’s happening with their numbers.
Is Power BI hard to learn?
Not really! Power BI has a simple drag-and-drop design. Even beginners can start with basic dashboards.
Can I use Power BI on my phone?
Yes! You can check your dashboards right from your smartphone or tablet.
Is Power BI free?
There’s a free version of Power BI that works pretty good for small tasks. But if you want advanced features like sharing reports across teams or real-time updates, you might need a paid plan.
What makes Power BI different from Excel?
Excel is awesome for spreadsheets, but Power BI is built for big data and fast insights. It connects to more data sources and creates interactive reports that are way more fun to use.
Want more information about our services?


Similar Posts

Discover How to Become a Power BI Developer in an Easy Step Guide
Data has emerged as the backbone of each business decision. As an end result, the call for professional experts who can examine and visualize this information has grown unexpectedly. One such function that has gained big traction is that of a Power BI developer. These professionals design interactive data dashboards for businesses. Interactive statistics dashboards […]...

Understanding Power BI Embedded Development for Seamless Data Integration
If you’ve been navigating the world of business intelligence software, the term “Power BI Embedded developer” would possibly have stumble upon your radar. These developers play a vital role in embedding Power BI reports into your company’s applications. They also integrate Power BI analytics into your existing applications. The ability to incorporate rich, interactive data […]...
Why Choose Microsoft Power BI Over Other Visualization Tools
Nowadays, businesses are dealing with huge amounts of data, which is true for brands hailing from diverse sectors. These entities obtain such data from both online and offline sources. The reality is just gathering data is not enough, but businesses also need to compile and process the data properly. This is where the data analytic […]...


