Data Cleaning in Power BI: Tips for Getting the Most Accurate Visuals

“Without clean data, or clean enough data, your data science is worthless.” – Michael Stonebraker, adjunct professor, MIT.
Imagine steering a ship with a damaged compass. It wouldn’t let you reach your desired destination. This is what it’s like to make decisions based on unclean data. It leads to misguided steps, financial losses, and missed opportunities.
Power BI is a powerful BI tool. It lets you connect, clean, and visualize data from diverse sources. But the output it gives directly depends on the quality of your input. Feed unclean data and you’ll end up with inaccurate insights. Data cleaning is critical to transforming data in Power BI for business growth.
Below, you’ll find out why it’s crucial. We’ll also explain how to clean data effectively.
The True Cost of Poor Data Quality
A Gartner study shows that companies lose $15 million annually due to poor data. More alarming is that 60% of them don’t even measure these costs. It means they don’t know how much go-to-market waste they create with poor data.
Another study by MIT Sloan says that bad can cost companies up to 25% of their revenue. Almost every startup today has bad data. This means that most of them are wasting their money, effort, and time daily.
Data leads to crucial decision-making at every step. From lead generation to lead nurturing, it plays a key role in everything. Clean data allows you to take focused action based on insightful information. Accurate data aligns your marketing and sales efforts with your end users’ needs. With cleaned data in Microsoft Power BI, you can build reports that expedite your ability to make actionable decisions for your business.
Clean and well-formatted data is critical for generating accurate insights and impactful visualizations.
What Is Data Cleaning in Power BI?
Data cleaning entails removing false or incomplete data in a dataset. Unclean data can also be duplicated or otherwise erroneous. In this process, you spot data errors. Then, you change, remove, or update data to correct them.
To transform data in Power BI, data cleaning is critical. It’s a core part of data preparation that readies the data for use in business intelligence. BI analysts and data scientists usually do data cleaning.
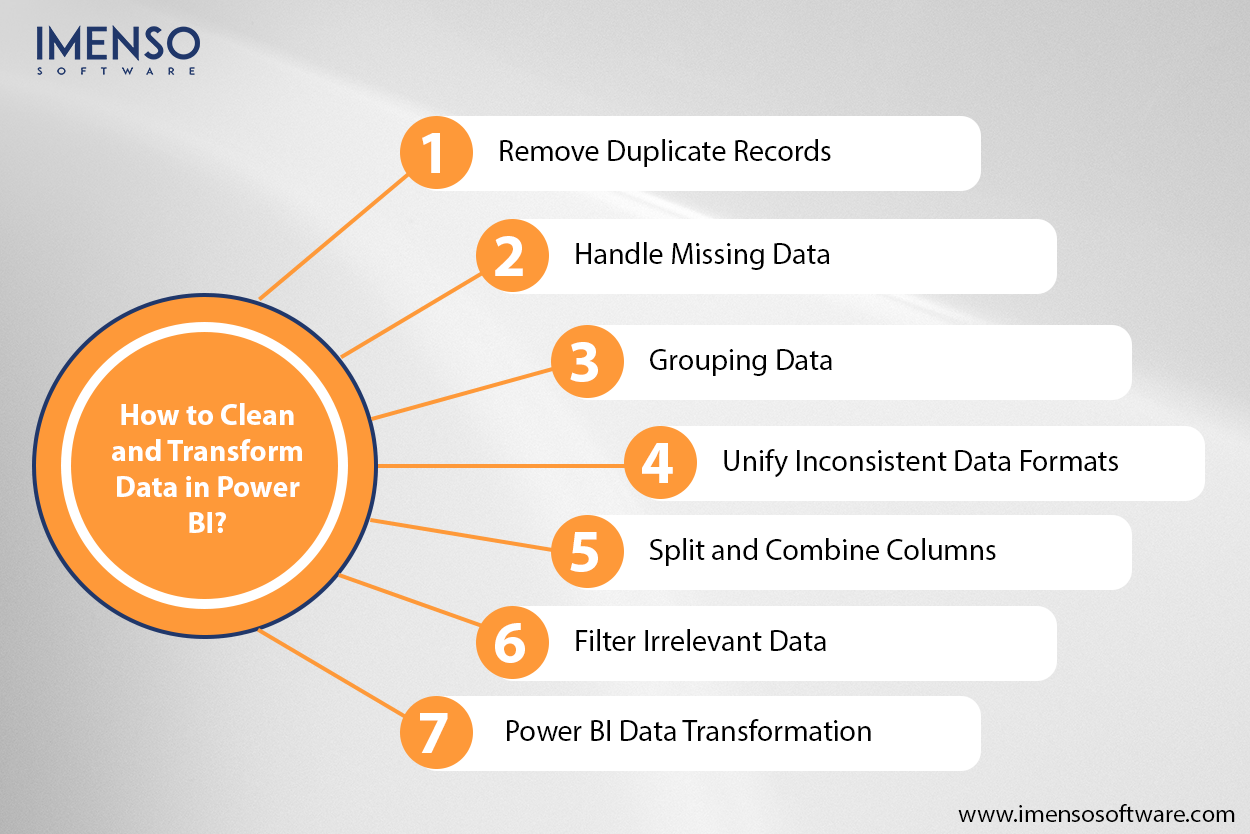
How to Clean and Transform Data in Power BI?
Power Query is used to clean and transform data in Power BI. The tool helps automate and simplify data preparation. Here is how to use it to solve some basic data quality issues.

1. Remove Duplicate Records
Duplicate records lead to inaccurate results. Below are the steps to remove them.
- In Power BI, go to Home.
- Choose Remove Rows.
- Now, in the Power Query Editor, tap Remove Duplicates.
- Depending on your needs, remove duplicates from a table or a column.
2. Handle Missing Data
Fix missing data through any of the ways below.
When There Are Few Missing Values
- Go to Home
- Choose Remove Rows
- Now, choose Remove Blank Rows
- Fill Missing Values
- Fill in missing values using the previous or next available value.
- Select the column
- Choose Transform
- Now, choose Fill Down or Fill Up.
Replace Missing Data
- Go to the Transform tab.
- Choose the Replace Values option to replace missing values with a default, mean, or median value.
3. Grouping Data
Grouping data lets you combine data based on specific criteria. It makes the analysis more efficient.
- Choose the column you want to group by.
- Go to the “Modeling” tab.
- Click on “Group By”.
- Define the grouping criteria.
- Name the new grouping column.
- Review the changes.
4. Unify Inconsistent Data Formats
Inconsistent data formats lead to inaccuracy during data analysis. Follow these steps to standardize data formats.
- In Power Query Editor, use the Data Type drop-down to standardize date columns.
- Use the format options in the Transform tab to standardize text data. You can convert it into proper case, uppercase, or lowercase.
- Use the Data Type option to format numerical data as decimals, percentages, or whole numbers.
5. Split and Combine Columns
You can split and combine columns when the data in them isn’t suitable for analysis.
Split Columns
- Select the column to split
- Go to Transform
- Choose Split Column. Split by a delimiter (a space or comma) or other criteria.
Merge Columns
- Choose the columns to merge
- Go to Transform
- Choose Merge Columns.
6. Filter Irrelevant Data
- Filter out unneeded data through these steps.
- Go to the Home tab.
- Tap the Filter Rows option as per your criteria.
7. Power BI Data Transformation
To transform data in Power BI means changing it for effective analysis. Below are the methods to do so.
Pivot/Unpivot
- For columns that represent data that should be rows or the other way around, go to the Transform tab.
- Here, use the Pivot Column or Unpivot Columns options.
Grouping Data
- Group data based on specific criteria to merge values or simplify your dataset.
How to Format Data in Power BI
Power BI data transformation isn’t complete yet. Your data is clean. But you need to format it. This makes it readable. Below are some strategies to format data.
1. Custom Columns
Create custom columns to format data.
- In Power Query Editor, go to the Add Column tab.
- Choose Custom Column.
- Here, use the DAX formula to create new columns.
2. Conditional Formatting
- Conditional formatting highlights critical data points in your visuals.
- Choose the column you want to format in the Visualizations pane.
- Go to the Format tab.
- Choose Conditional Formatting. Here you can apply data bars, color scales, and more as per specific conditions.
3. Data Labels and Titles
Check if all visuals have axis labels, titles, and data labels. This enables the reader to understand your reports better.
4. Customize the Number Format
Customize the number format for numerical data. Match it with your report’s context.
- Go to the Fields pane.
- Choose the relevant column.
- Under the Modeling tab, adjust the Format option.
Useful: Hire Dedicated Power BI Consultants
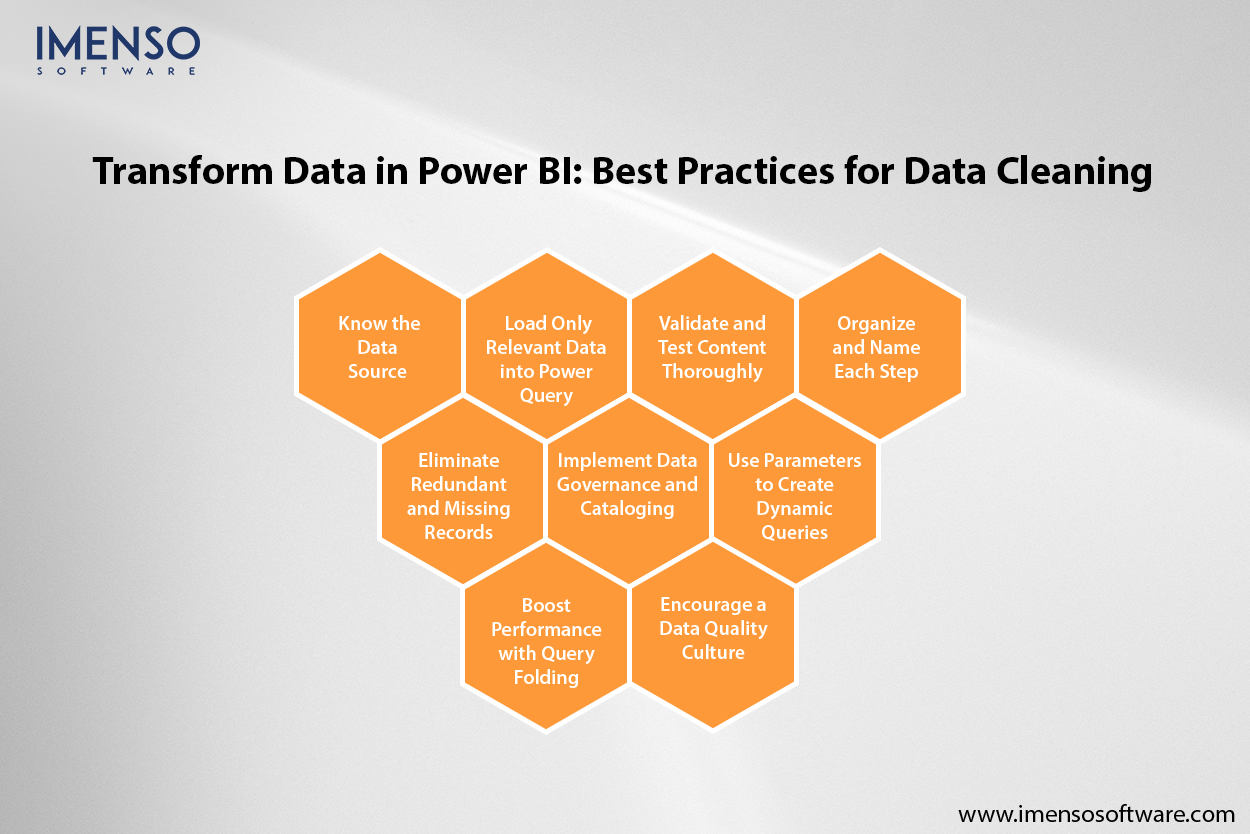
Transform Data in Power BI: Best Practices for Data Cleaning
Below are some of the best Power BI tips and tricks to clean data effectively.

1. Know the Data Source
Learn about the quality and structure of the data first. Then check for inconsistencies. If you are combining various sources, record the data sources used. It helps with updates and fixing issues when they occur later.
2. Load Only Relevant Data into Power Query
Apply filters to import only the needed data into Power Query. Do this before loading big datasets. Only load the columns required for analysis. Eliminate others to minimize the query complexity.
3. Validate and Test Content Thoroughly
Validating content means checking that calculations correspond to the expected results. It ensures the quality and reliability of the data. Test your data accuracy against known metrics. This will help you spot errors early. It is ultimately critical for a better end-user experience.
4. Organize and Name Each Step
Power Query applies transformations stepwise. Organize the steps logically for better data processing. Give each step a clear and descriptive name. It ensures that you know what is done. Once done, review the Applied Steps pane. Check whether all transformations are valid. If there’s a step you don’t need, remove it.
5. Eliminate Redundant and Missing Records
Use the Remove Duplicates in Power Query to remove duplicate records. To fill in missing records, use the Fill Up/Down feature. If there are blanks, use Replace Values.
6. Implement Data Governance and Cataloging
Good data governance maintains data quality. Use trusted, high-quality data sources and maintain a data catalog. By supporting certified datasets, you ensure everyone uses consistent data in their reports. This cuts down unplanned errors. It also builds user confidence in your data. For this, use tools like Azure Purview. It integrates with Power BI to help you find reliable data and track its source.
7. Use Parameters to Create Dynamic Queries
Create a parameter in Power Query to adjust the query. Parameters let you adjust the query without changing the full dataset. Create reusable queries with parameters. It will help with repetitive tasks. It also simplifies making changes when there is an update in the data source.
8. Boost Performance with Query Folding
Query folding refers to Power Query pushing transformations to the data source to process it. Apply transformations like filtering, joining, and merging as soon as you can. It lets the source database take care of the heavy processing. This boosts performance.
If you link to SQL databases, use native database queries. It helps you directly control the way data is pulled into Power Query.
9. Encourage a Data Quality Culture
Foster a culture where analysts take the duty of data correctness. It is critical to use tools that automate manual data cleaning. Executive support for data quality initiatives is crucial for success. As the owner or senior staff, you must champion data quality. It will show its significance to the entire company.
Learning Through an Example: Data Cleaning in a Sales Department
Here’s an example to better understand data cleaning in Power BI. Imagine a sales department in a retail company. It uses many data sources. These are product, sales, and customer data. Below are ways we can apply the best data cleaning practices.
- Spot and fix data quality issues. These may be wrong or missing customer data.
- Remove duplicates. Fill in missing data, like missing product information.
- Merge data from various sources. These include customer data, product data, and sales data.
- Transform data into a consistent format. For example, converting dates to a uniform date format.
- Spot patterns with data profiling.
- Create a data refresh schedule. This ensures that all the data is up to date.
Clean and Transform Data in Power BI Effectively
Cleaning and transforming data in Power BI is critical for insightful reports. The Power Query Editor allows efficient shaping of data. Follow the guide above to clean data and resolve common quality issues. These steps serve as the basis of accurate data analysis in Power BI.
To get the most out of Power BI for business intelligence, reach out to Imenso Software. We excel in Power Query transformations. Connect with us to boost the value of your Power BI investment today.
Frequently Asked Questions
1. What techniques would you use to clean a data set in Power BI?
Various techniques help clean a data set in Power BI. These include removing irrelevant columns and filtering rows. You must also validate data. It’s critical to remove rows and columns with missing values as well.
2. What is the best way to refresh data in Power BI?
Go to the Home ribbon and tap the Refresh button. Another way is to choose the Refresh data button in the context menu on any table in the Data pane. In Power BI Desktop, data refresh happens alongside schema refresh.
3. How do you handle duplicates in data cleaning?
You can handle duplicates by deleting or merging them. Delete them if they are irrelevant. You can merge them if they show valid data. In this case, you can also replace them with a single record.
4. Why is formatting critical in data cleaning?
Formatting standardizes data. It helps you spot errors. Thus, it makes way for trustworthy data cleaning. Formatting supports various data types. It leads to smooth interoperability across data systems.
5. What is deduplication in data cleaning?
Deduplication involves removing the same data entries from data sets. For this, you divide the data into various data blocks. These blocks have unique hash codes. If one has code matches with the other, it’s a duplicate. You need to delete it.
Want more information about our services?
Similar Posts

Data Governance in Power BI: What Every Enterprise Needs to Know
“Too often we forget that genius, too, depends upon the data within its reach, that even Archimedes could not have devised Edison’s inventions.” ~ Ernest Dimnet, priest, writer, and lecturer We live in an age where data-driven companies outperform others. Businesses that cannot make the most of it are bound to fail. Companies across sectors […]...

How Power BI Professional Services Can Transform Your Business Operations
Imagine being in a boardroom when someone asks how your company has performed in the Asia-Pacific region during the last quarter. Rather than tediously searching through endless spreadsheets or ordering a report that will take days to develop, you whip out a beautiful, interactive dashboard from your tablet and present live data with vibrant visualizations […]...

18 Outstanding Power BI Dashboard Examples
Microsoft Power BI is a powerhouse when it comes to data analytics and visualization, offering a load of tools and features to cater to various business needs. Among its many capabilities, exploring Power BI dashboard examples showcases how effectively businesses can create impactful dashboards to visualize and interpret data. In this evolving landscape of technology, […]...


