Business Intelligence vs Big Data: The Key Differences
Lotte.com is a famous online shopping mall in Korea. Some time ago, the company faced a unique challenge. Their site received a million daily visitors. But out of them, just a few actually bought stuff.
To solve the issue, Lotte’s general manager started using customer experience analytics. They soon found out that people wanted new product combinations. Lotte wasted no time in giving shoppers what they wanted. As a result, the company increased $10 million in sales!
It’s easy to see the reason behind the growth. Lotte’s BI analytics program helped assess shopper behavior accurately.
Tesco, the UK’s grocery has been using data since 1955 to learn more about its customers.
Today, the company generates volumes of data, also called Big Data. Now, it leverages this data not just for buyer behavior. From supply chain to marketing, it analyzes big data from various sources.
Harnessing Big Data has helped Tesco become the UK’s biggest grocery store in no time at all!
Big Data vs. BI: Which Does What?
In the above two case studies, we used the words BI (Business Intelligence) and big data. BI helped Lotte increase sales dramatically. Tesco used big data analytics to become a major player in the market.
Evidently, there doesn’t seem to be much variation between BI and big data. But is that the truth? As it turns out, it’s not. It’s common to hear both terms being used alternately. The reality is that both are distinct concepts.
BI analyzes structured data in a business. Its main goal is to empower companies with strategic decision-making. Big data is broader in scope. It covers both structured and unstructured data sources. The aim is to drive growth with deep insights.
Knowing about both concepts helps you comprehend which one is more suitable for your goals
What Is Business Intelligence (BI)?
BI converts raw data into wisdom. It arms businesses with the right knowledge that drives strategic decision-making. How can you tell that a company uses BI? Such an organization has a thorough view of its data. They use it to propel meaningful change, fix challenges, and swiftly adapt to market changes.
BI is an umbrella term. It combines business analytics, data visualization, and data mining, among other things. BI tools help companies access various types of data, such as past, current, and more. Users analyze it to gain insights into the business’s performance.
“With a functioning BI infrastructure, the current keepers of an organization’s data can move beyond shepherding data to shepherding the organization by concentrating on making the key business decisions they were hired to make.”
― Brian Larson, Data Analysis with Microsoft Power BI
Is BI the Same as Data Analytics?
BI involves data analytics. So, it’s common to assume that the two concepts are the same. Again, that’s false. So, how do data analytics and business intelligence differ?
BI lets you make better decisions. This decision-making stems from BI’s analysis of your current business data. Business analytics is a subset of BI. It provides a solution-focused analysis. Analytics in business intelligence consists of tools for identifying and storing data for decision-making.
Here’s an example to help you understand the differences between business intelligence vs. data analytics. BI tells a company how many new customers it gained last month. It can also tell if there was an increase in the orders as opposed to last month.
Business intelligence, on the other hand, suggests the most helpful tactics or methods based on the current business data. In this example, business analytics will suggest increasing advertising spend to offer incentives to new customers.
What is Big Data?
Big data is a term for humongous and diverse collections of data. It comprises various data types. Structured, semi-structured, and unstructured data, big data covers all of it. A definitive trait of big data is that it keeps growing with time. Datasets are not only huge. They are also complex in velocity, volume, and diversity.
Big data’s exponential growth comes from tech advancements. AI, IoT, and connectivity are key elements that drive this growth. As this data grows, new tools emerge to gather, process, and analyze it in the shortest time.
Big data analytics helps society in various ways. An example of this is monitoring payment patterns. Analysts then analyze them against past customer activity. This helps detect fraud in real-time. Another is using AI technologies like NLP. NLP analyses unstructured medical data. On its basis, it offers valuable insights for better patient care.
“Big data is at the foundation of all of the megatrends that are happening today, from social to mobile to the cloud to gaming.” — Chris Lynch
Business Intelligence vs. Big Data: Key Comparison Points

A. Data Volume
BI
BI typically deals with vast volumes of structured data. But it operates with the limits of data warehousing. BI mainly deals with only structured data. This data is stored in relational databases.
BI apps work with structured data sets from internal sources. Some examples are SQL databases and spreadsheets. The volume of data is fairly less than Big Data.
Big Data
Big Data deals with extremely large data sets. Not only are they large, but also complex. General data analysis tools cannot analyze such datasets. Big Data includes structured data. An example is an inventory database.
It also deals with unstructured data. This includes social posts. Unstructured datasets also consist of mixed data sets. Big data sets can be anything from the finance worksheet of a company to a piece of poetry.
B. Analytical Focus
BI
Analytics in business intelligence focuses on merging and visualizing data. The end goal is to support strategic decision-making. BI analyses data to create reports and dashboards. It thus gives a high-level overview of the data.
Another name for BI is DSS (decision support system). The name aptly explains BI’s analytical focus. It processes current and past data. Then, it gives its findings in an easy-to-grasp manner. This, as we have already mentioned, is in a visual format, like charts, reports, etc.
BI is also sometimes called descriptive analysis. This is so because it describes the current and past performance of a business. The analytics it does help answer questions like “what happened?” and “what needs to change?”
However, BI analytics does not give answers to questions like why something happened. It will also not anticipate what might happen in the future.
Big Data
The analytical focus of big data is much broader in scope. Analytics in big data involves discovering trends, patterns and links in huge amounts of raw data. This helps with data-driven decision-making. Methods like regression and clustering are used for big data analytics.
Big data deals with a large diversity and complexity of data. The analytics cannot happen if the data is unclean. To analyse big data, analysts first clean the data. Then, they use the following techniques to analyse it.
1. Data Mining
It sorts through large datasets. This helps spot deviations. On this basis, analysts can discover patterns and relations in the data.
2. Predictive Analytics
It uses the company’s past data. This data is the basis on which forecasts about the future are made. It helps spot future risks and opportunities.
3. Deep Learning
It mimics human learning patterns with AI and ML to layer algorithms and spot patterns in the most complex data.
“In 2007, for the first time ever, more information was generated in one year than had been produced in the entire previous five thousand years – the period since the invention of writing.”
Me the media: rise of the conversation society – VINT editions (research institute of Sogeti), 2009, p. 270. by Jaap Bloem, Menno van Doorn, Sander Duivestein
C. Data Sources
BI
BI sources comprise a range of external and internal data.
I. Internal Sources
Transaction Processing Systems
These include ERP, CRM, and financial systems. They help with tracking daily operations. They provide detailed information about crucial things. These are sales, inventory, customers, and more.
Operational Databases
These databases store particular business data. It is related to specific apps. They offer a granular view of operations.
II. External Sources
Market Research Data
This includes data from market research firms and industry analysis. The data offers insights into competitive landscapes, market trends. It also helps assess customer behavior.
Social Media
Social media channels offer insights into customer sentiment. They also help gauge brand reputation and new trends.
Third-Party Providers
Data aggregators, government agencies, and other firms can provide data relevant to certain business needs.
Other Data
This comprises press clippings, reports on new markets, and data from IoT devices.
Big Data
Big data comes from multiple diverse sources.
Social Media Data
Social media platforms generate a massive volume of data every second. Data includes posts, likes, shares, comments, and more.
Machine Data
IoT devices, sensors, and system logs are sources of this data. Manufacturing, agriculture, and the logistics sector produce machine data.
Transaction Data
Transaction data comprises digital records from financial firms. It also comes from e-commerce sites and point-of-sale systems.
Healthcare Data
The healthcare industry gathers and processes critical data. This data comes from hospitals, clinics, and wearable devices.
Government and Public Data
Government agencies and public firms generate data from various sources. These are weather monitoring, census collection, and transportation systems.
Media and Entertainment Data
Streaming services, gaming apps, and digital publishers track user activity.
Industrial Data
Industrial data comes from robotics, manufacturing programs, and supply chains. It is crucial for process optimization.
Scientific Research Data
Fields like genomics, climate studies, and astronomy produce extensive datasets. The data comes from experiments and observations.
D. User Roles
BI
There are four primary types of users who engage with BI.
Executive Users
These are high-level decision-makers within a firm. They include CEOs, CTOs, or department heads. They rely on BI to access summarized and visualized data. This data gives them an overview of KPIs and critical metrics. BI data also gives them insights into the firm’s performance.
Analytical Users
This category consists of data analysts and data scientists. They use the data to pinpoint patterns and trends. Analytical users often have strong technical skills. They turn raw data into actionable insights for business growth.
Operational Users
Operational users are directly involved in routine operations. They rely on BI to track and manage their workflows. These people are mainly managers and front-line staff. They need access to updated data to make timely decisions.
Self-Service Users
Self-service users are those with a basic grasp of data analysis. They prefer to explore data and create their own reports and visualizations. These can be business users from various teams who need on-demand access to data.
Big Data
Big data is mainly used by industries and firms.
Businesses
I. Retail
Companies like Amazon and Walmart use big data to uncover customer preferences. They use it to personalize shopping experiences and product recommendations.
Telecommunications
These companies use big data to understand customer usage patterns. Based on it, they personalize their services.
Manufacturing
Manufacturers use big data for predictive maintenance. They also use it to optimize the supply chain. Big data analytics also helps them improve their production processes.
Financial Services
Financial institutions use big data to assess risk and detect fraud.
Marketing & Advertising
Companies use big data to target certain buyer segments. They use it to optimize marketing campaigns.
Transportation
Big data powers apps like Google Maps. It also helps with traffic management and route optimization.
Healthcare
Healthcare staff use big data to analyse patient records. On its basis they also personalize treatments and develop new drugs.
Social Media
Social media apps use big data to grasp user behavior. Big data analytics helps them optimize content delivery, and do targeted advertising.
II. Governments
Public Services
Governments use big data for urban planning. Other uses include traffic management and crime prevention
Emergency Response
Big data helps in emergency response. It enables emergency professionals to impart timely disaster relief measures.
Policy-Making
Governments use big data to inform policy decisions. They also use it to assess the efficacy of programs.
III. Non-profits
Nonprofits use big data to understand their audience. Big data analytics helps them optimize fundraising efforts and enhance program effectiveness.
IV. Research Institutions
Research firms conduct studies, assess trends, and create new technologies by analyzing big data.
BI and Big Data: A Dual Path to Smarter Business Decisions
BI and big data share many things in common. But they also differ in a few key ways. BI focuses on enabling firms to make tactical decisions. Big data consists of volumes of diverse data. Analyzing this data opens the way for innovation and growth. As data volumes increase, using both BI and big data is a step forward. It allows organizations to become data smart and gain a competitive edge.
Frequently Asked Questions
- What is the difference between data intelligence and BI?
Data intelligence and BI help with informed decision-making. But they have different scopes and use cases. BI analyzes past data to offer insights. Data intelligence covers a greater range of methods. It includes advanced analytics and ML.
- What are the 5 V’s of big data?
The 5 Vs of big data are qualities that define large datasets. They are volume, velocity, variety, veracity, and value. Every big data set has these 5 V’s.
- What is the difference between a business intelligence analyst and a data analyst?
BI and data analysts use data to make decisions. But they differ in scope and focus. BI analysts primarily focus on past and current data. They present the data in a visual format. Data analysts use a broader range of methods. They leverage predictive and prescriptive analytics to discover insights.
- What are business intelligence tools used for?
BI tools collect, assess, and present business data for better decision-making. They help firms learn trends, spot patterns, and derive insights from data. This leads to process efficiency and data-led decision-making.
Want more information about our services?
Similar Posts
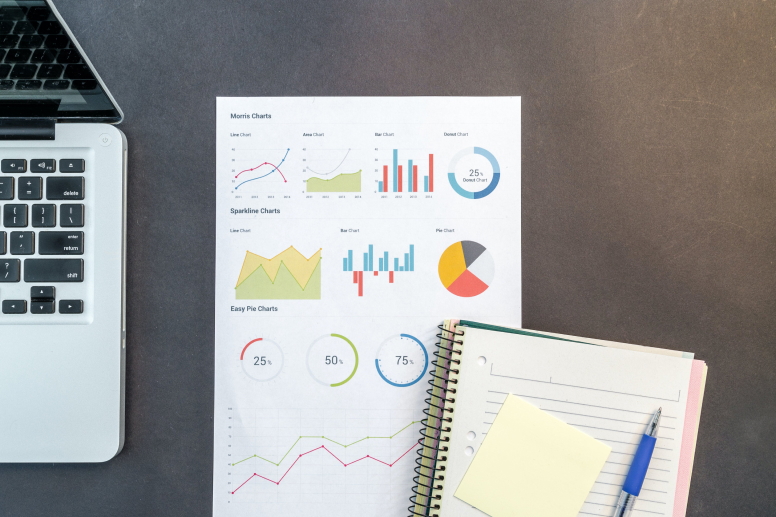
A Practical Guide to Data Visualization with Power BI
Are you struggling to make sense of the overwhelming volume of data at your fingertips? Are static spreadsheets and dull charts leaving you yearning for a more impactful way to visualize your insights? Look no further! In this data-driven age, unleashing the power of data visualization has become a game-changer for businesses seeking to make […]...
8 Mistakes Businesses Make When Adopting Power BI and How to Avoid Them?
Numbers have an important story to tell. They rely on you to give them a voice. ~ Stephen Few Did you know, data is ultimately an organizational asset? You can transform it into information that facilitates actionable-insights for your organization. Microsoft Power BI does just that. You can connect disparate data sets, transform, and clean […]...

10 Powerful Steps For How to Become a Power BI Expert
The huge data era is right here. By 2026, the worldwide big data enterprise is expected to develop to an impressive $450 billion, according to analysis. Businesses are speeding up to evaluate and get prices from their sizeable data repositories as a result of the exponential boom of data. Aspiring tech workers now have a […]...
