Power BI vs Google Data Studio: Which is Better for Business Intelligence?
82.6% of businesses today have a Chief Data Officer.
3 in 5 companies use data analytics to propel business innovation.
90% of businesses consider information and analytics key to their business strategy and success.
What do all these statistics point to?
Businesses are swiftly becoming data-driven.
The race to be so stems from various reasons. These are rapid technological advancements and the recognized value of data. As businesses grow more data literate, becoming data-driven is an inevitable step.
Data-smart businesses leverage business intelligence (BI) tools to stay ahead of others. Power BI and Google Data Studio (Looker Studio) are two trending BI programs. Companies use them to make informed decisions about various issues. But does one of them offer better intelligence than the other? Can you benefit more from Power BI or Looker Studio?
The comparison below will give you answers to all these questions.
What is Power BI?
Power BI is a BI dashboarding and reporting system. It has strong data and analytics abilities. Businesses can tailor their features to suit their needs. Power BI has swiftly risen to the position of the best tool in the BI space. It offers deep insights through its solutions and custom data visualizations.
Power BI has more than 200 native data source connections. It has robust programming languages through DAX and M Query. Power BI also has enterprise features. These are deployment pipelines, dataflows, and more.
Power BI is a leading BI software, commanding a huge market share that surpasses even Tableau.
Related: Imenso’s Power BI Development Services
What Is Google Data Studio?
Google Data Studio was a data visualization tool. In 2022, Google rebranded it as Looker Studio. The tool turns complex data sets into easy-to-read reports. It lets you integrate data from various sources into one system. You can enhance your reports with tools like tables, text, and graphics.
Google Looker Studio supports more than 800 data sources. This includes external services like LinkedIn Ads and Facebook. All this ensures detailed reporting. The tool’s reports are dynamic. They update automatically with new data from the sources.
Globally, in 2025, over 7887 businesses have started using Google Data Studio as a Data Visualization tool.
Power BI vs. Looker Studio: An In-Depth Comparison
Both are leading BI tools. The comparison below will help you find out which one will serve you the best.
Power BI Installation
Power BI Desktop is the main app of Power BI to design and build reports. You can download it through any of these ways.
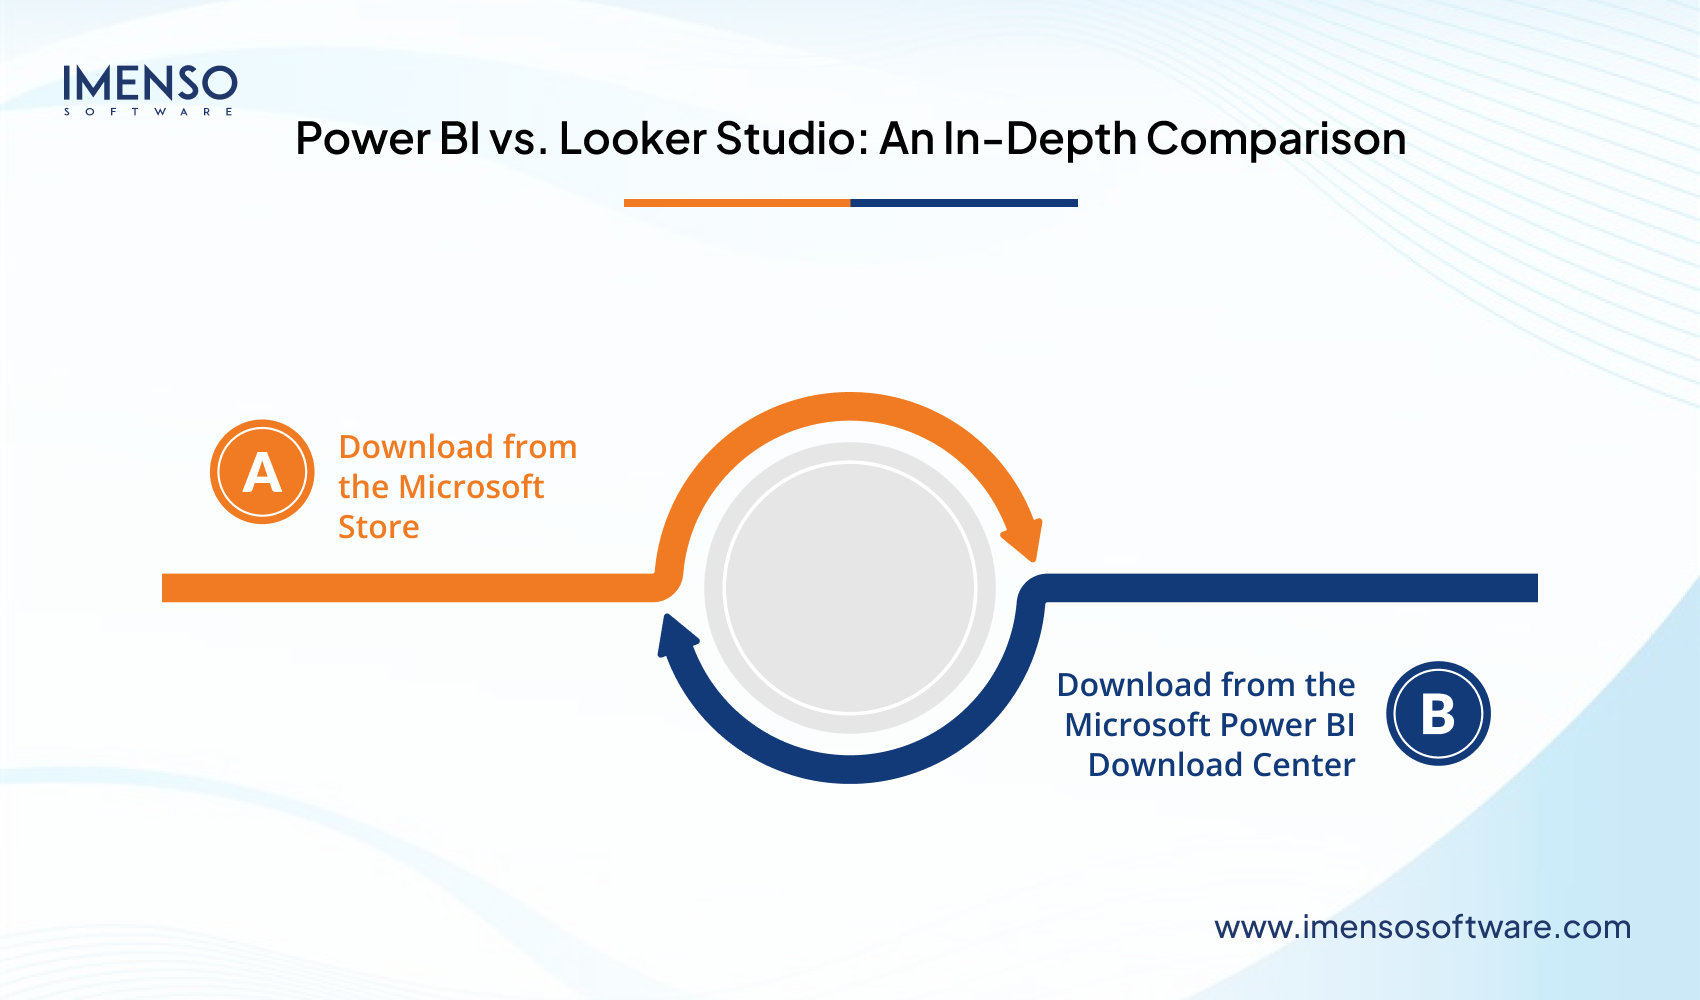
a. Download from the Microsoft Store
- On your PC, open the Microsoft Store.
- Type “power bi desktop” in the search bar.
- Choose the app and tap “Get.”
- The Store will install the app itself once it downloads.
b. Download from the Microsoft Power BI Download Center
- Go to the Power BI Desktop product page.
- Choose “See download or language options”.
- Log in to the Power BI Service.
- Tap the download icon and choose Power BI Desktop.
- This will take you to the Microsoft Download Center.
- To proceed, tap “Download”.
- After downloading, run the installation and follow the prompts.
Google Looker Studio Installation
Looker Studio is cloud-based. The installation is quite simple.
- Visit https://lookerstudio.google.com/
- Log in with personal or business Gmail.
- Tap “Blank Report.”
- Tap “Add Data”.
- Pick from the various connectors.
Data Integration in Power BI
Data integration in Power BI is a strategic asset. It unifies data from various sources into one model. This lets businesses get an overall of their functions. It thus empowers them with shared insights. This Power BI feature allows businesses to make data-driven decisions.
a. Tools for Data Integration in Power BI
1. Power Query
It lets you quickly connect to a range of data sources. You can then apply various transformations to fit your analytical needs. These include merging, cleaning, and reshaping data.
2. Power BI Desktop
Here you create dashboards and reports. Analysts can import and model their data with Power BI Desktop and Power Query. This produces connections and computations that present business logic. You can tailor visualizations to create catchy narratives.
3. Power BI Service
Users share the results of data integration in Power BI Services. The cloud app has tools for regular data refreshes. It also has features for access control and collaboration. Thus, it serves as a great place for sharing insights across teams.
b. Data Sources, Integration Techniques, and Transformation
Power BI supports various data sources. These include cloud-based services, on-site systems, and real-time data streams. This lets a firm create a unified data ecosystem.
For data integration, Power BI offers the following techniques:
- Import: This is for static or infrequently updated data
- DirectQuery and Live Connection: It is for real-time access and large datasets.
- The Hybrid approach: It balances performance and freshness.
Power Query prepares data for analysis. It has tools to filter, reshape, merge, and transform datasets.
All these capabilities make Power BI a great system for turning raw data into data-driven insights.
Power BI integrations let you establish a single source of truth for your data.
Power BI integrations make it a centralized AI-powered data integration platform. It allows companies to fully harness the capabilities of predictive analytics and forecasting.
Data Integration in Google’s Data Studio
Google Data Studio fluidly integrates with Google apps. It means that if you use Google Analytics in Power BI, the process may not be as smooth as if you use it with Data Studio.
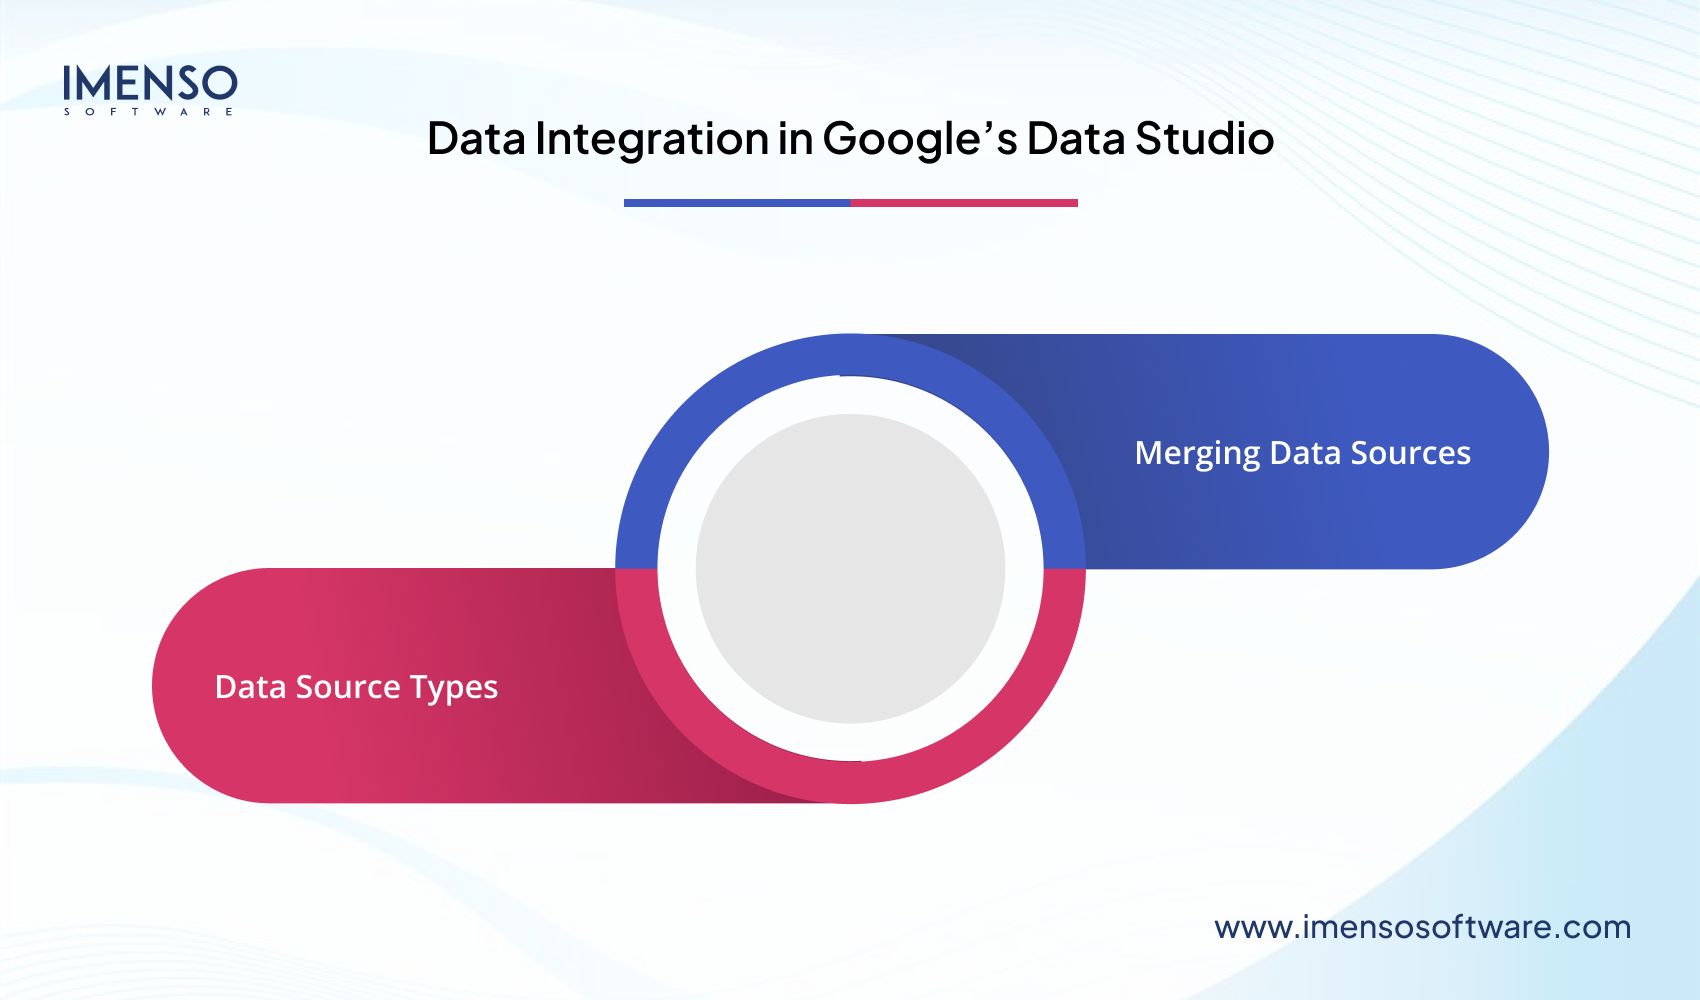
1. Data Source Types
Data Studio is a Google product. So, there are various native integrations to Google sources. These include Google Analytics, Google Ads, Google Sheets, and more. Moreover, there are more than 400 partner connectors present. They let you link to data sources such as Adobe Analytics and Facebook.
A benefit of data studio connectors is that you can build your own. This is helpful if you can’t find a good one for your needs. Data Studio can link to both SQL and NoSQL-based data sources.
2. Merging Data Sources
You can merge various data sources in a dashboard to create tables and graphs. The data blending option allows you to create charts based on various data sources. You can blend up to 4 data sources. But this can happen only at the report level. You cannot view them on your data sources home page.
Google Data Studio’s integrations give businesses a unified, real-time visualization of data from various sources in one place. This view is critical for quick and more effective decision-making.
Analytics Capabilities in Power BI
Power BI’s analytics features are way more robust. So, in a comparison between Looker vs. Power BI on this front, Power BI is a definite winner. Below are its analytics abilities:
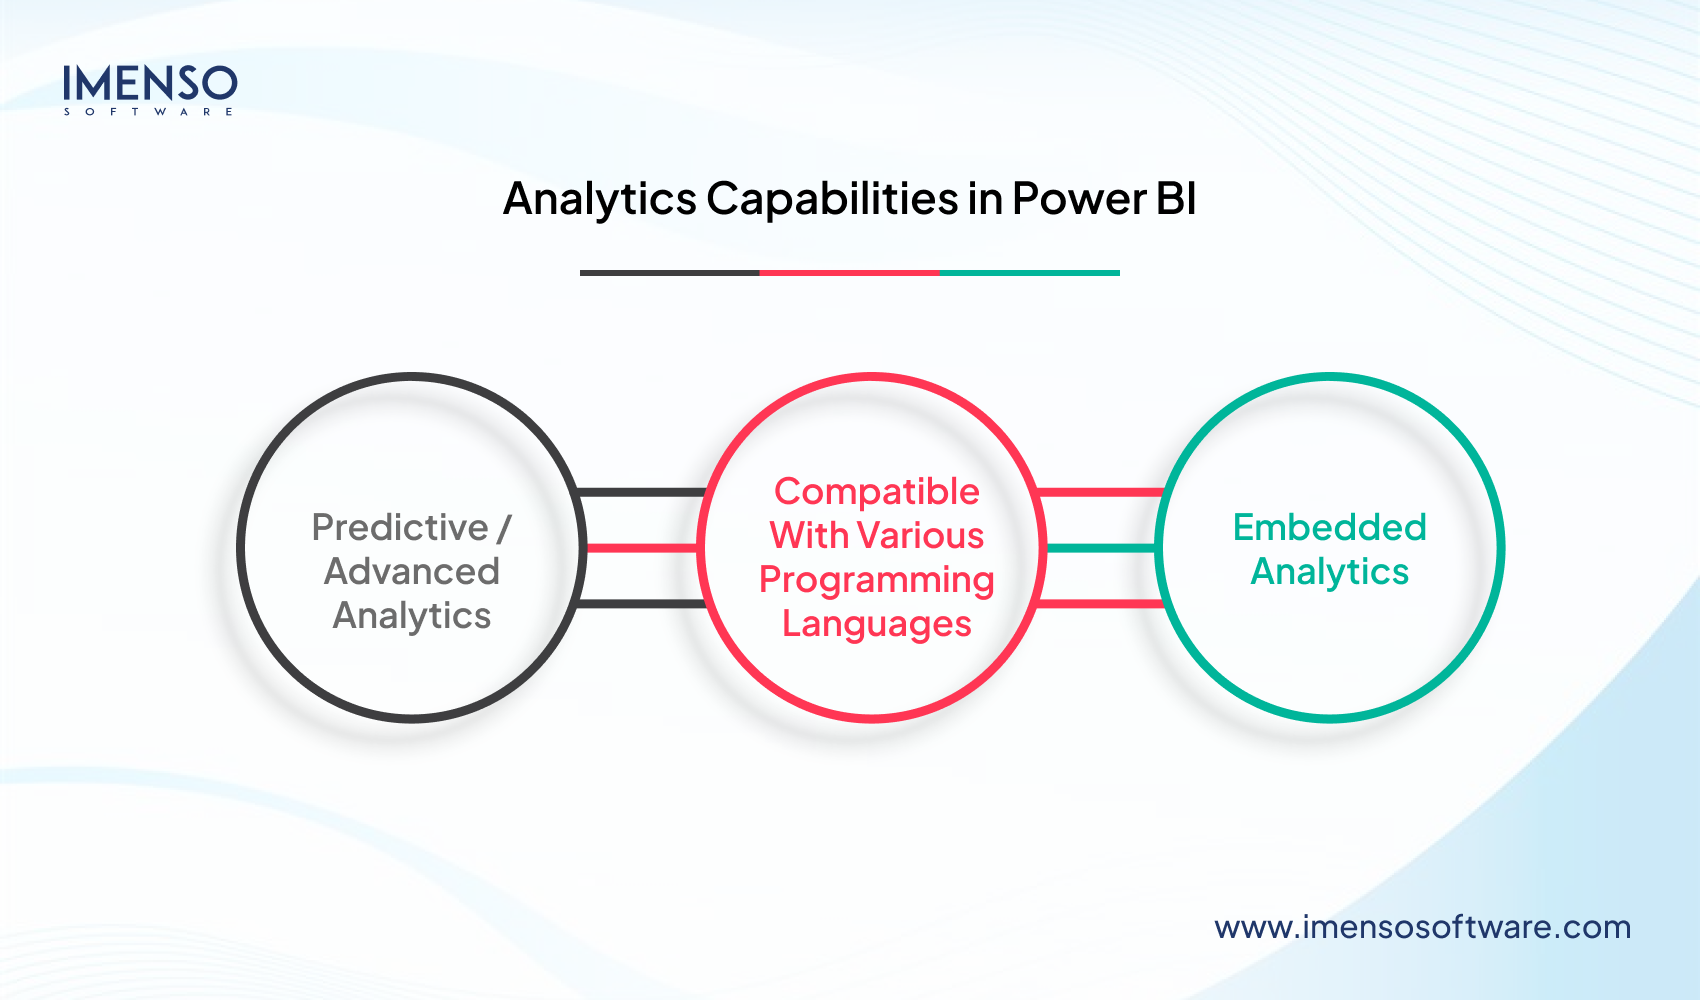
a. Predictive / Advanced Analytics
Power BI offers various analytics features for various needs. These are:
- Clustering techniques
- Analyze features
- Time series analysis
- Quick insights
- Advanced analytics custom visuals
- AI Insights
- PowerBI Dashboard
b. Compatible With Various Programming Languages
Power BI supports various languages. This lets you ingest, transform, and visualize data. These are:
- Data Analysis Expressions (DAX)
- Multidimensional Expressions (MDX)
- Power Query Formula Language (informally known as “M”)
- SQL
- R
- Python
c. Embedded Analytics
Power BI embedded analytics has two solutions:
1. Embed for Your Customers
This solution lets you create an app that uses non-interactive authentication against the BI tool.
2. Embed for Your Organization
With this, you can build an app that needs signing in via Power BI credentials.
Power BI’s analytics capabilities turn raw data into actionable insights. These insights offer three key benefits to businesses in the form of operational optimization, cost-effectiveness, and an improved customer experience.
Analytics Capabilities in Google Data Studio
Google Looker Studio is not an analytics engine. So, it does not offer much in this regard. But you can use Google Analytics in the Looker Studio for this purpose. Below are all the analytics capabilities that Google Analytics offers:
-
-
a. Built-in Automation
-
This helps you find actionable insights. You can predict future actions and create a full picture of customer journeys. It also helps you discover useful metrics, and reports.
-
-
b. Privacy-Safe, Machine Learning-Based Models
-
They help you learn customer behaviors and conversions. You can do this based on observed data.
-
-
c. Funnel Exploration
-
With this, you can visualize how your users complete a task on your site or app. It lets you determine whether they are over-performing or under-performing audiences.
-
-
d. Data Collection and Management Tools
-
These include collection APIs and admin APIs.
-
-
e. Segment Overlap
-
This lets you set new criteria. You can then find new customer segments that fit those criteria.
-
-
f. Advertising Workspace
-
With this, you can examine multichannel media expenses. Thus, you can create better advertising budgets.
Looker Studio lets you visualize trends, compare metrics, and explore data interactively. This enables businesses to understand performance, spot opportunities, and act on data in real time.
Data Transformation in Power BI
Power BI has strong features to clean, reshape, and enrich your data. Below are some of the key ones.
a. Power BI Report, Data, and Model Views
The desktop version of Power BI offers three views. Each of them is distinct. It means they serve a different purpose in data transformation.
Report View
Report view is where your new, enriched data comes to life. You can see it in the form of charts, tables, and visuals. Users can quickly download the data as a PDF. Then it can be shared with key people in the company.
Data View
In the data view, you can rename fields and recategorize data. You can also modify data types. Data view makes your data suitable for visualization.
Model View
Here, you can create links between various data sources. For example, if you have data from Google Ads and Google Analytics 4. In the model view, you can connect them based on a common field. For example, “campaign name” to create a cohesive dataset for analysis.
Power Query
The Power Query editor is one of the most advanced features in Power BI. This built-in transformation program lets you transform data into any shape. It also offers various other functions. These functions are absent in the Looker Studio.
In Power Query, you can view all your tables. Then, perform transformations. For example, you can manage columns and change data types. You can also combine data and do many more things.
DAX
DAX (Data Analysis Expressions) is for more technical users of Power BI. It’s a library of functions and operators. These include additions (+), subtractions (-), or logical operators (AND, OR). You can combine them to create formulas and expressions.
DAX complements Power Query. It offers various more transformation abilities. DAX offers more benefits and customization. You can create custom calculations. These are the ones that aren’t present in the Power Query. It’s very useful for those who need a new metric that combines elements from current columns. DAX lets you define a formula to create this novel metric.
DAX also lets you create complex filters. You can do so based on various criteria.
b. Features of Power BI Data Transformation
There are three standout features of Power BI data transformation. These are:
-
-
- Power Query offers many options to transform and enhance data.
- Users can transform the data at various stages in Power BI. You can do so from data extraction or within the visualization system itself. It means that you have more control over the transformation process.
- Power BI can handle large datasets. This is especially so when combined with a data warehouse. Data Studio by Google lacks a bit in this regard. If you try to pull more data than usual, the dashboards stop loading.
-
Data transformation is a critical tool that improves a company’s use of data to meet goals and grow its business.
Data Transformation in the Google Data Studio
Data transformation is a critical element when comparing Power BI vs. Looker. Looker Studio offers many options to clean, shape, and analyze data.
a. Data Transformation Tools in Google Data Studio
The program has various tools for this. These are:
Custom Fields
You can create new fields based on current ones. This lets you get new metrics from your data.
Filters and Parameters
Filters let you choose specific subsets of data for analysis. Parameters allow you to interactively modify the data shown on a report.
CAST Function
This function turns data from one type to another (for e.g., text to numeric).
CASE WHEN Function
This function lets you conditionally transform data based on certain criteria.
Data Visualization
Looker Studio offers various chart types and formatting options. Through them, you can visually present your transformed data visually.
Beyond Built-in Tools
You can also use external data preparation tools and data warehouses. These third-party tools perform more advanced transformations. It is done before importing data into the Looker BI software.
b. Key Features of Data Transformation Tools in Google Data Studio
Multiple Data Sources
Looker Studio’s data transformation tools can work with various data sources. You can easily merge data from many sources, such as databases, APIs, and more, into a unified dataset.
Complex Calculations and Transformations on Data
These tools can perform complex calculations and transformations on data.
Data Visualization
The data transformation tools also have many built-in data visualization options. This lets you quickly and easily create charts, tables, and more. They can also connect with various BI tools and platforms. So, it is easy to share your insights with a broader audience.
Simple User Interface
The tools are intuitive and easy to use. There are built-in help resources offering detailed explanations of all the tools.
Data Governance
Data transformation tools in BI Looker have data governance features. They allow for Data auditing, data security, and data lineage.
Automated Data Pipeline
You can schedule and automate data pipelines and data transformation jobs. Thus, it becomes easy to maintain updated data sets.
Google Looker Studio vs. Power BI: Pricing
Now, this is an area where the comparison is extreme. Power BI is a paid BI tool. Google Data Studio is free.
Price of Power BI
Below are 3 pricing options for Power BI.
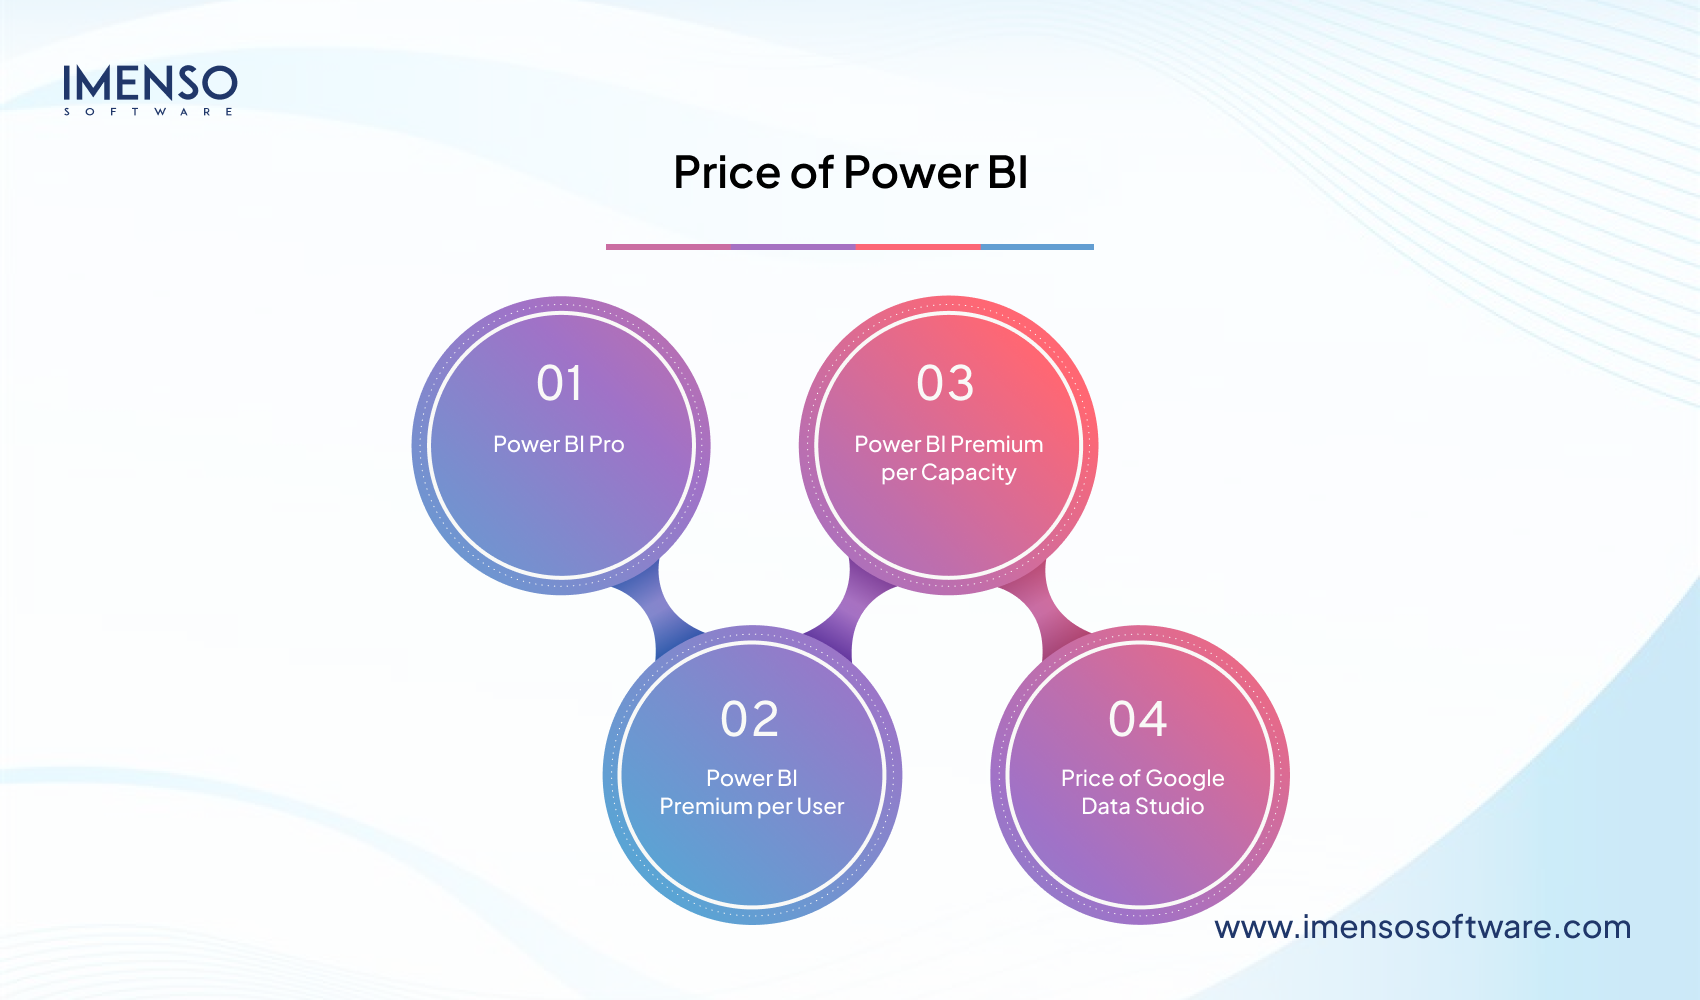
Power BI Pro
License users with modern, self-service analytics. It lets you visualize data with live dashboards and reports. You can share and share insights across teams. It costs USD 9.99 per user per month.
Power BI Premium per User
License users to expedite access to insights. It has advanced AI and self-service data prep for big data. It costs you $20 per user per month.
Power BI Premium per Capacity
This option does not come with a user limitation. It costs $4,995 per month.
Price of Google Data Studio
To use this BI tool, you just need a Google account. Visit datastudio.google.com and start using the tool for your needs.
Must Read: The ROI of Power BI: Metrics That Matter to CXOs
Power BI vs. Looker Studio: The Verdict
A close look at Data Studio and Power BI leaves us with a definite answer. Power BI undoubtedly emerges as a clear winner. The BI tool is perfect for businesses with more advanced intelligence needs. If you use a wide range of data sources, you require a tool with robust transformation abilities. This is exactly where Power BI delivers beautifully.
Contrarily, if you depend on Google-based data sources, try the Data Studio. It does not offer advanced data modelling features. So, if you have limited business intelligence needs, Looker Studio can be the right choice. You can use the tool without any cost.
To make the best choice, carefully review your needs, budget, and technical capabilities. It will help you decide the most suitable option for yourself. Hopefully, you’ll be able to turn your BI initiative into a success.
Frequently Asked Questions
1. Which is better, Google Data Studio or Power BI?
Google Data Studio has a simple interface. It smoothly integrates Google products. Power BI offers enterprise-grade features. It has AI-powered analysis and strong data source integration. If you have basic BI needs, Looker Studio may be the right choice. For firms with advanced BI needs, Power BI will be a great option.
2. Is Google Analytics better than Power BI?
Power BI and Google Analytics serve different needs. Power BI offers data visualization and data analysis. It also focuses on data reporting across data sources. Google Analytics is more geared toward web analytics. Its main purpose is to track site performance and visitor behavior. Due to this, it’s more often used for digital marketing purposes.
3. Which is better, Power BI or SQL?
The answer to this depends on your data goals. Power BI is for data visualization and business intelligence. MySQL manages structured data. It mainly serves as a database backend. To make the right choice, you must assess your needs.
4. Is it easy to deploy Tableau or Power BI?
Tableau offers cloud and on-premises options. Still, companies struggle with the tool’s deployment. Power BI is cloud-based. Firms can deploy it smoothly with Microsoft integration. So, for cloud-forward businesses, Power BI is the better choice.
Related: Tableau vs. Power BI: Which Data Visualization Tool is Best for Business?
Want more information about our services?


Similar Posts

How Microsoft Business Intelligence Consultants Drive Success
When the time passes every business is moving towards hiring an expert culture. But stop, do you know there are still many small businesses that come with this question? What’s that…The question is do we need a consultant? So the answer is yes! It’s true nowadays every business needs a professional who can skyrocket your […]...

Power BI for Non-Tech Executives: A Simple Guide to Smarter Business Decisions
Millions saw the apple fall, but Newton was the one who asked why. ~ Bernard Baruch Ever looked at a sea of numbers and thought, There must be a better way to make sense of this? You’re not alone! Because data isn’t just for data scientists; it’s for everyone! The Microsoft Power BI is a […]...

Expanding Your Business? See How Automation Softwares Can Help You Do It Sooner
From the perspective of sales, growing a company means more and more of it. But more sales are a result of well thought out ideas and flawlessly executed systems. In recent times, every company that transitions from small scale to big leagues has had technology at the centre of its expansion plan....


