A center of excellence that supports delivery and augments capabilities of revenue cycle management solutions for providers and payors, including Patient Access, Coding, and Accounts Receivable services. Specifically for payors, we provide a one-stop solution using end-to-end, integrated pre- and post-adjudication workflow tools that turn your data into information, while dramatically improving quality, profitability and customer service.
We have used Dataflow which was the new data modeling capability provided in Power BI Services to directly load data from the server into the cloud and then use the Power BI Dataflow connector in the Power BI Desktop to fetch data directly from that.
This solves the problem of providing the access via SSH tunnel/VPN.
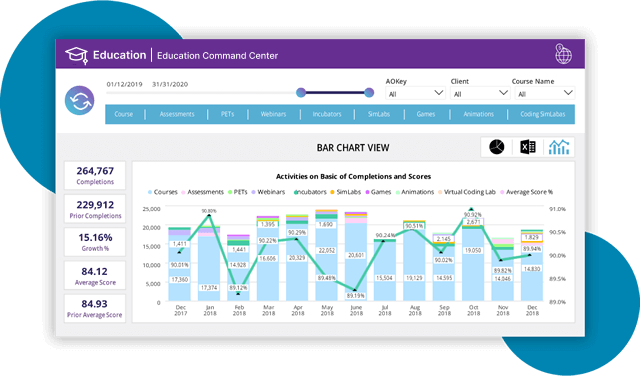
This is the overview dashboard of all the activities trends in the selected date range to get the overview of different entities.
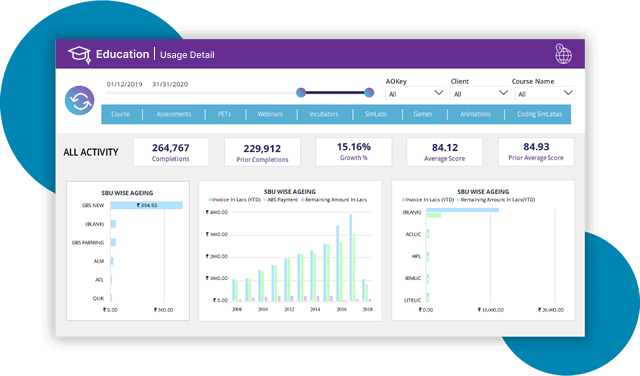
This is the detail view of all the activities/course name over the period of time to get prior values and growth % based on it.
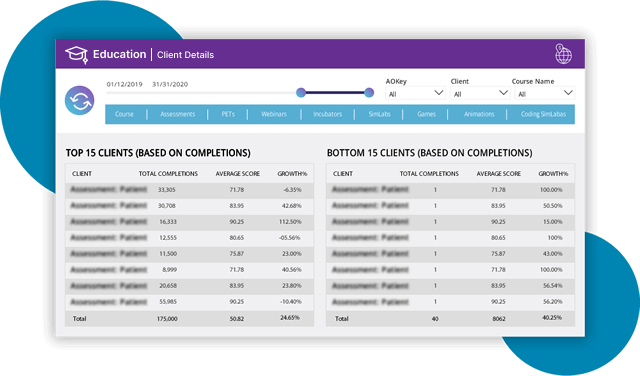
This is the detail view of all the clients over the period of time to get the top and bottom clients details with their usage behavior.
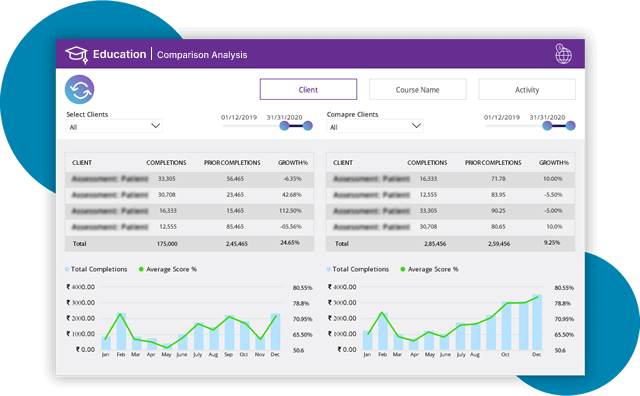
This is done to compare between two different aspects(Client, Activity and Course name) of the data in a single page view to compare them based on different date filters to predict things accordingly.
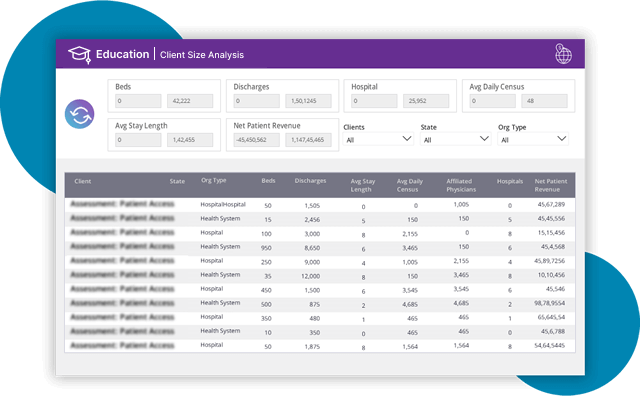
This is a useful page to compare similar entities with each other to see the behavior of large, medium and small size clients based on different attributes.
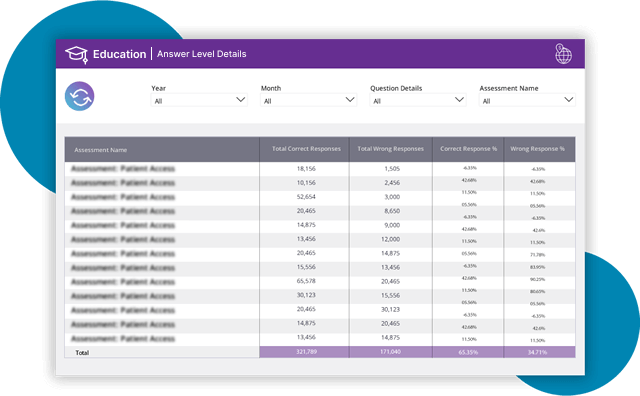
This report helps in analyzing the behavior of all the courses/activities to see the trend or wrong and correct attempts to particular questions. This help in sorting the issue of why a particular thing is being attempted incorrectly most of the time. By this, we can update our courses approach to a more advance and better way.
We have all the required expertise to help your business grow


