Simplifies and streamlines the patient financial experience by communicating with patients early, informatively, and often through our proven patient engagement platform and team of highly-trained support specialists.
We have replicate their production database in SQL server and connected to that with a use of a VMware Client which have the Power BI Desktop installed on it.
All the BI files are created there only and then published to Power BI Services. We have two Workspaces- QA (Shared Capacity) and Production (Premium Capacity). All this centralized the files and help the users to customize things in Power BI Desktop files as well.
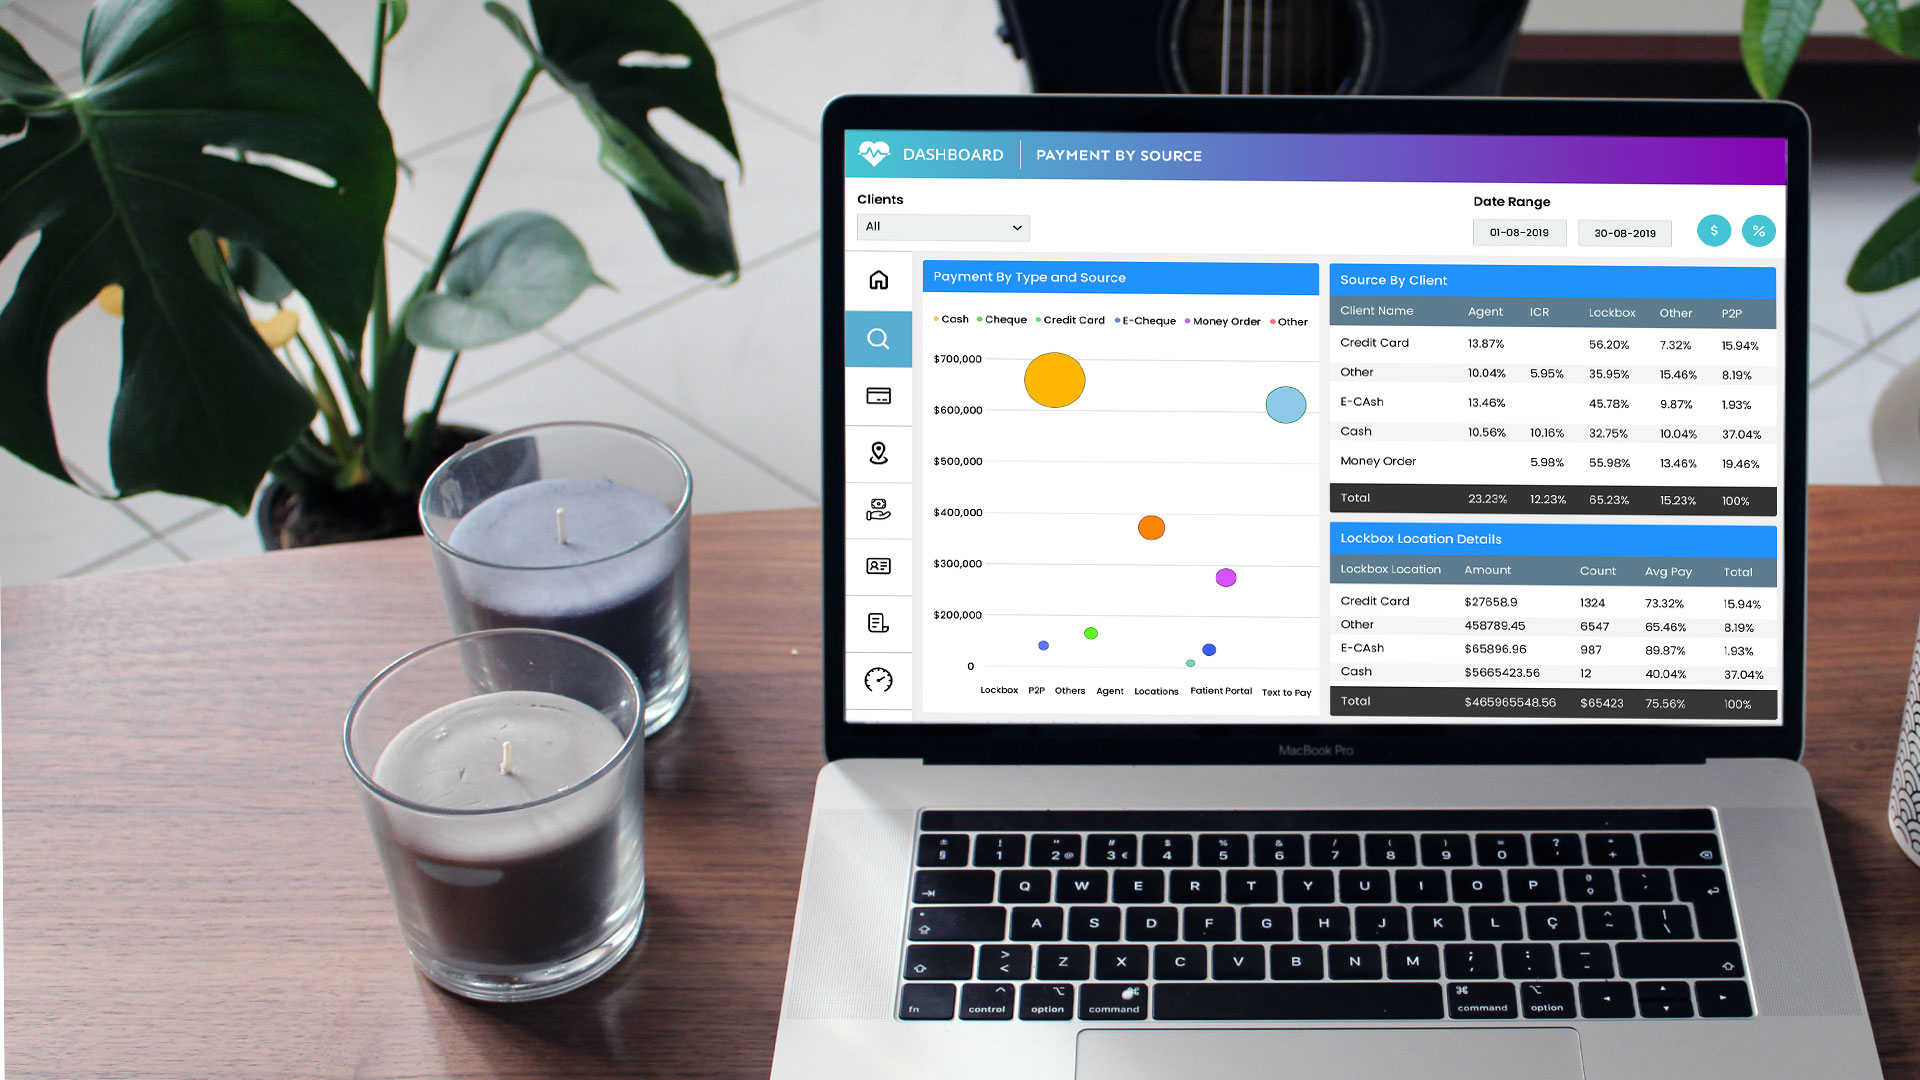
This is the overview BI app which consists of all the segmentations of the business like Payment, Placements, Statements, Call Time, Status, Aging and more, to get different trends of these entities in different date ranges.
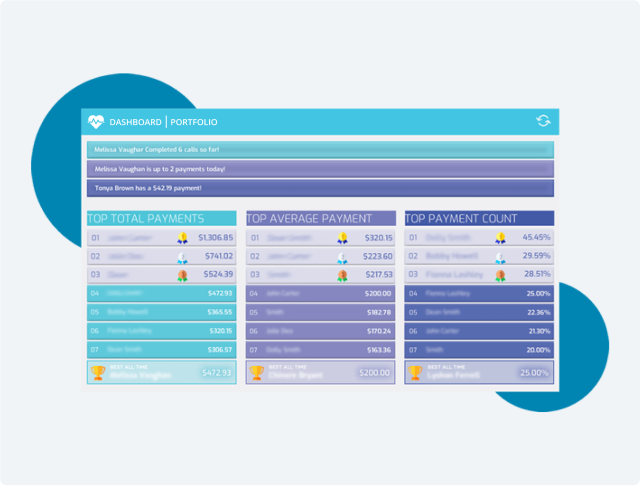
This is the detail view of daily activity to get the Agent Performance Information to be displayed on a screen. This help them to see and compete with the best of the best on daily basis. This looks like a gaming dashboard and the idea was to see the leaderboard on daily basis.
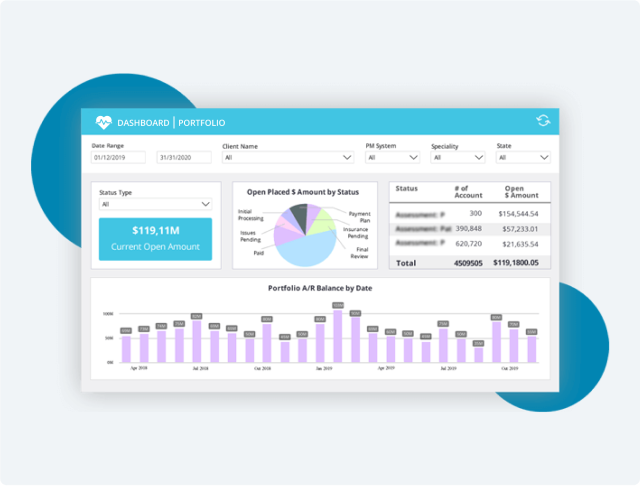
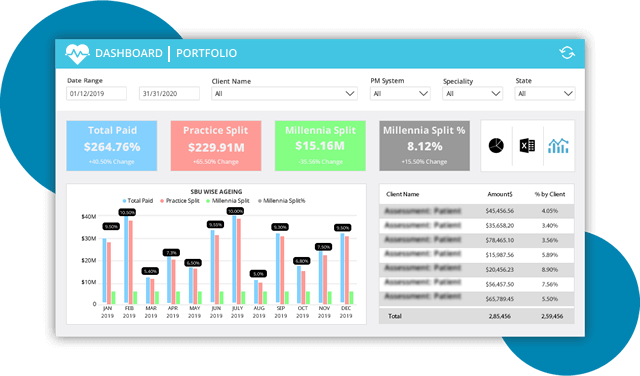
This is the overview of all the different segmentation like Payments, Placements, Statements and Calls over the period of time to get the top movers and losers details with their usage behavior. It provides the prior period calculations and daily averages which will help us to see the trends of our clients.
We have all the required expertise to help your business grow


