Healthcare analytics: crafting insights for enhanced patient care.
- Industry: Healthcare
- Country: USA
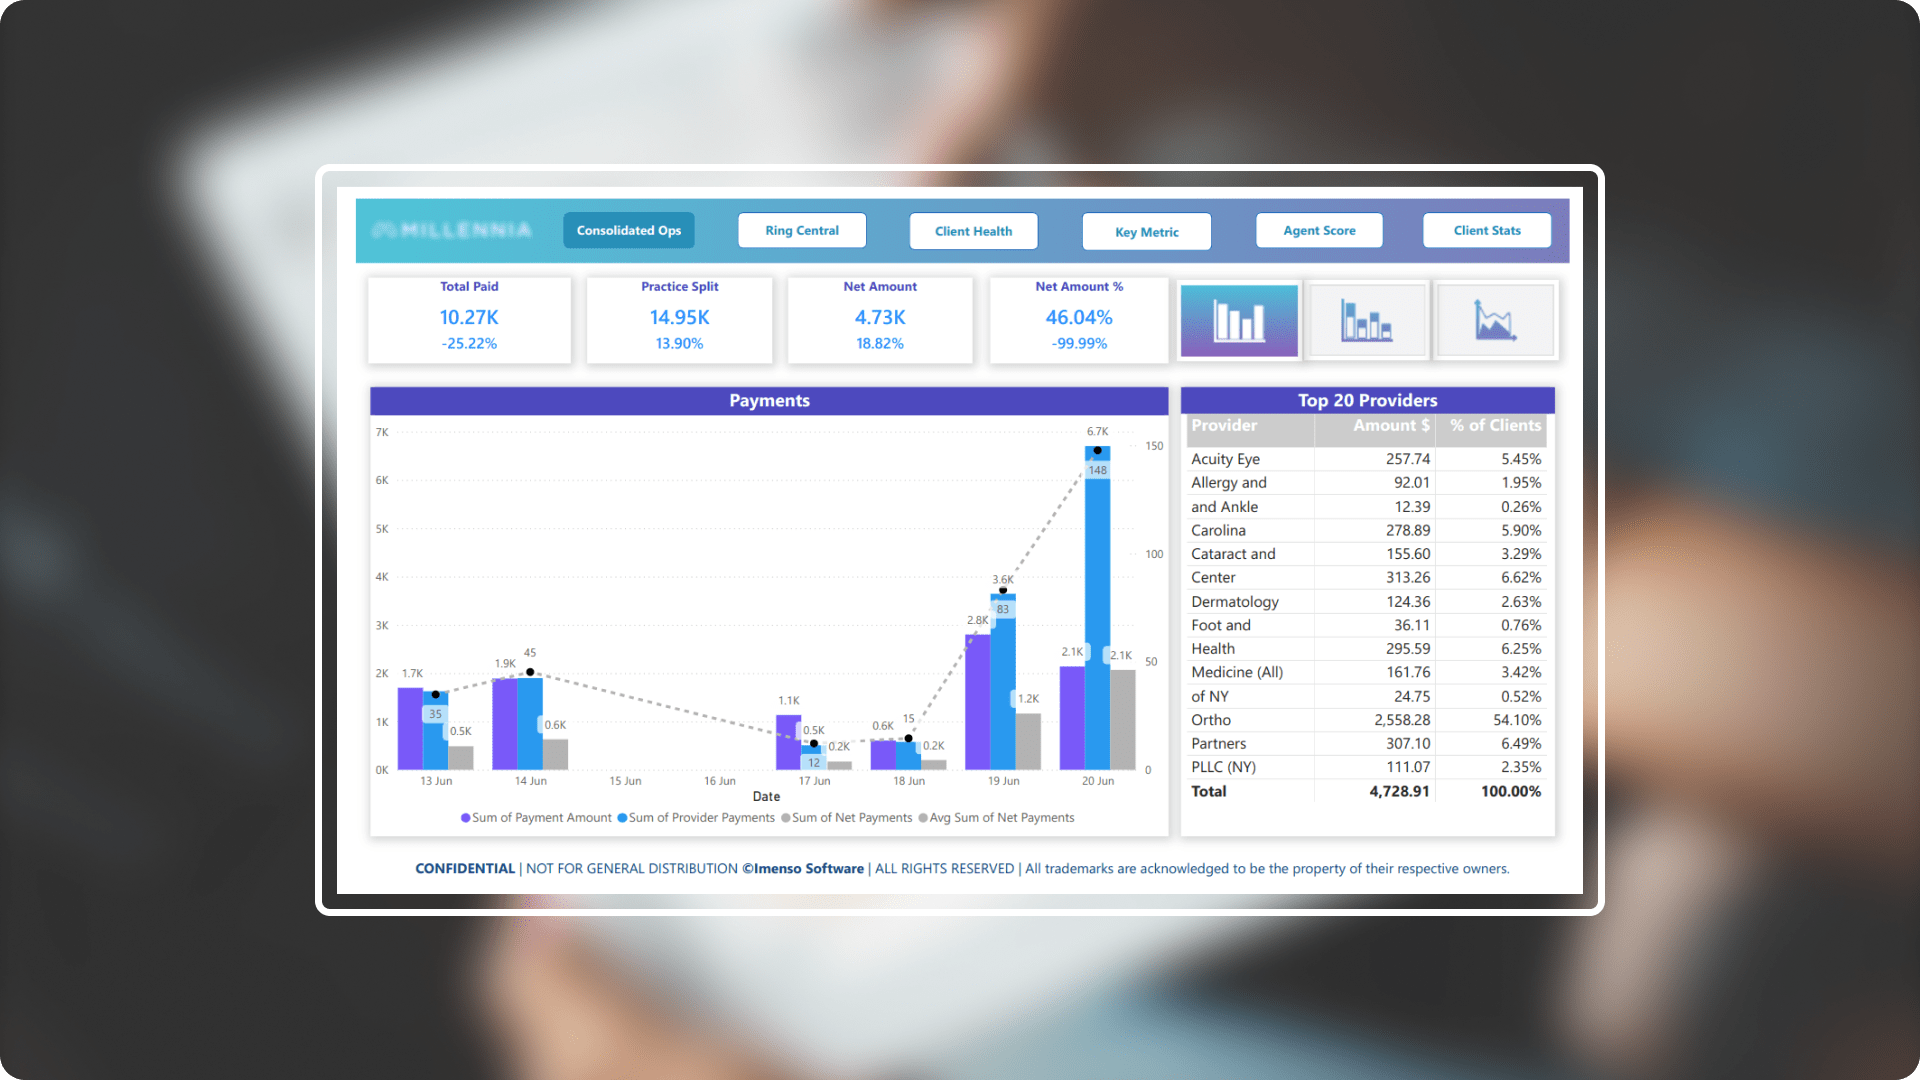
The main objective of the Client Dashboards is to ensure complete accuracy of all data, from the moment of pre-arrival until the moment of post-visit to the hospital. With the help of our vast array of innovative and pioneering Power BI services, businesses can fully and effectively utilize the power of their data to make wise and strategic decisions and achieve expansion.
The core challenges
- Unified data integration: Working in healthcare, client faces challenges with diverse data formats, such as CSV and Excel files. To address this challenge, client integrates data from SQL Server, MySQL Server, CSV, and Excel files, along with SSIS packages for consolidation. Additionally, Visual Studio is utilized to build SSAS tabular cubes.
- Live connected data: Since client uses real-time data and is connected with SSAS tabular cubes, it’s difficult to work with cube data. So, for this, we use the Tabular Editor tool, which helps in creating, analyzing, and editing the DAX measures.
- Data privacy and security: Client face challenges in safeguarding sensitive information from unauthorized access and destruction. So, client utilizes the row-level security feature, underscoring its commitment to data privacy and security.
- Predictive analysis: To obtain knowledge and make wise judgments, healthcare professionals must be able to interpret prediction models. So, client uses the Forecast feature to analyze future data using historical data to get findings that are nearly correct.
Solution By streamlining data workflows and automating repetitive tasks, client's Power BI solutions help organizations optimize their operational processes, reducing manual errors and enhancing overall efficiency.
-
 External tools: Client uses third-party tools like Tabular Editor, ALM Toolkit, and DAX Studio in its Power BI Reports to enable quick edits. With the aid of these technologies, users may improve data modelling, accelerate development processes, and maximize DAX queries for increased effectiveness and speed.
 -
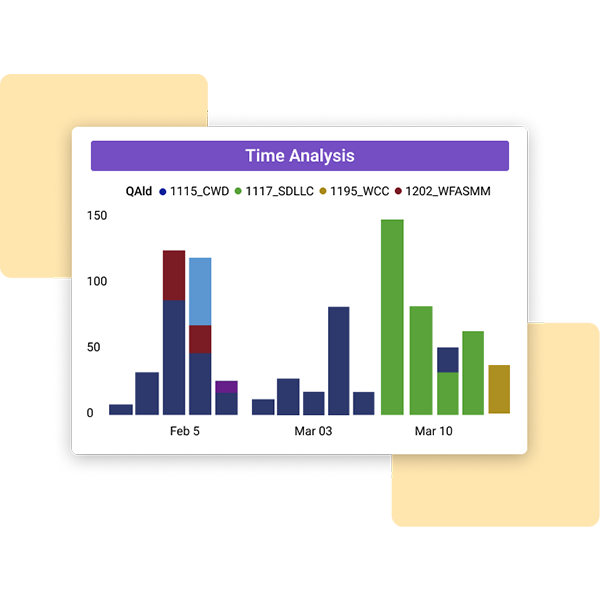
 Time intelligence: Client optimizes the quantity of DAX measures in their datasets by using the Tabular Editor to apply the Time Intelligence DAX measures. This method not only improves performance but also makes sure the dataset doesn't get too big.
 -
 Customized dashboards and reports: Client provides reports and dashboards that can be customized to meet your unique needs. We enable users at every level to make data-driven decisions with our user-friendly visualizations, which range from executive summaries to detailed operational analytics.
 -
 Data modelling optimization: Client optimizes the data with the help of simple data models, use relationships with appropriate cardinality and cross-filter settings and it avoids unnecessary relationships.
 -
 Embedded analytics: The reports are embedded into the portal for enhanced accessibility and streamlined data dissemination. This provides users with a simplified way to access all relevant reports and data information.
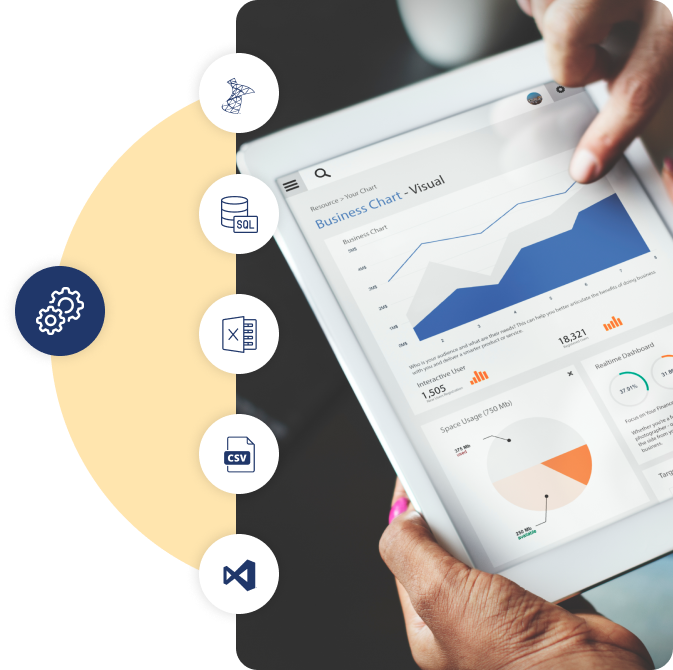
Integration.
Equipped with a variety of
data source.
When working on data integration, it's vital to consider the compatibility and scalability of each source, which will ensure smooth transitions and accurate data mapping throughout the process. The different data sources that are used in client are as follow -
- SQL Server
- MySQL Server
- Excel
- CSV
- SSIS Packages
- Visual Studio(SSAS Tabular Cubes)
Customization.
How we played with charts?
We crafted the charts to elevate data visualization, guaranteeing a spot-on representation that matches each chart's distinct traits.
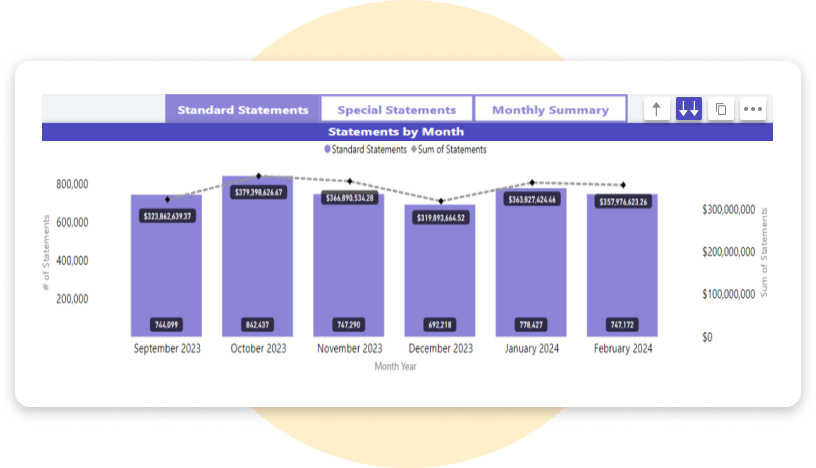
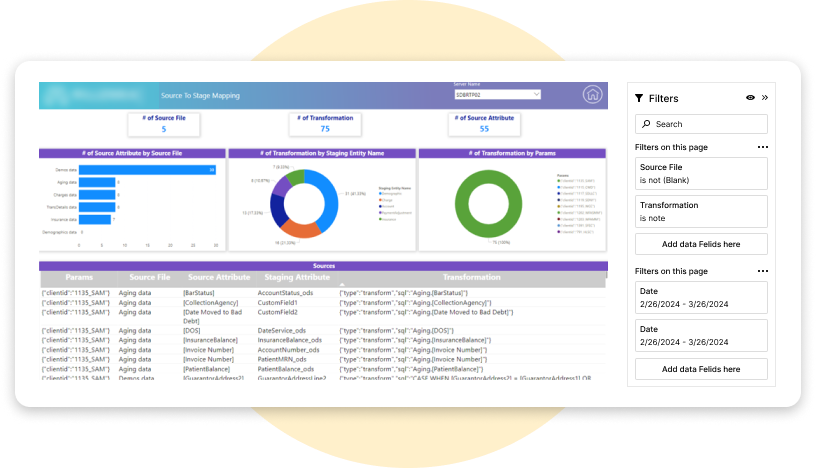
Field – Parameters
In Power BI, field parameters serve as the glue that effortlessly merges two charts, allowing them to harmonize their data and present a unified narrative.
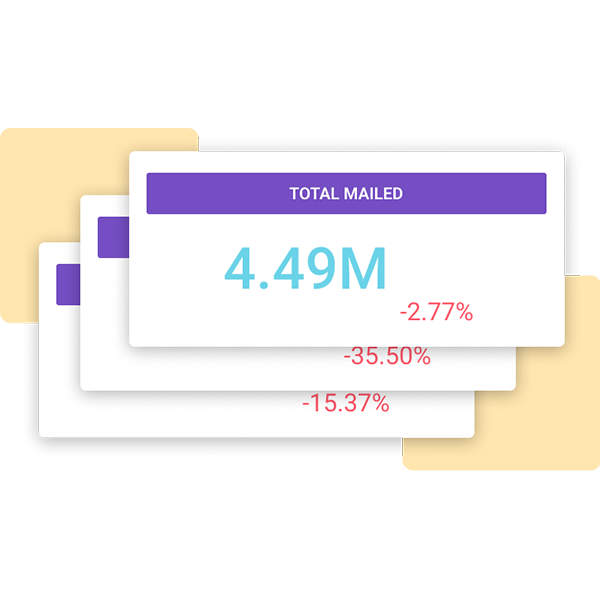
Card with state by OKVIZ
In client Power BI charts, we utilize the power of the OKVIZ card with states for unparalleled customization. This dynamic tool empowers us to design our visuals with precision.
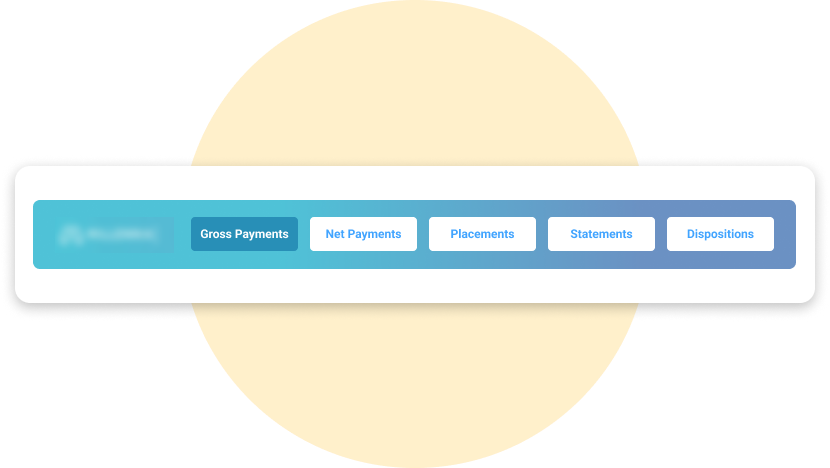
Navigation cards
Navigation Cards help you glide to your desired sections with just a click.
Dynamic charts
The dynamic charts help in switching the visuals from one chart representation to another.
Tooltips
The customized tooltips offer a glimpse into the data like never before. Seamlessly integrate information and enhance comprehension for a truly immersive analytics experience.
Enhancement.
By adding useful features.
Multi-Row cards
Several cards can be combined into a single visual within the chart by using the Multi-Row Card visual. This feature simplifies the way data is presented by letting users examine different measurements side by side in an understandable manner.
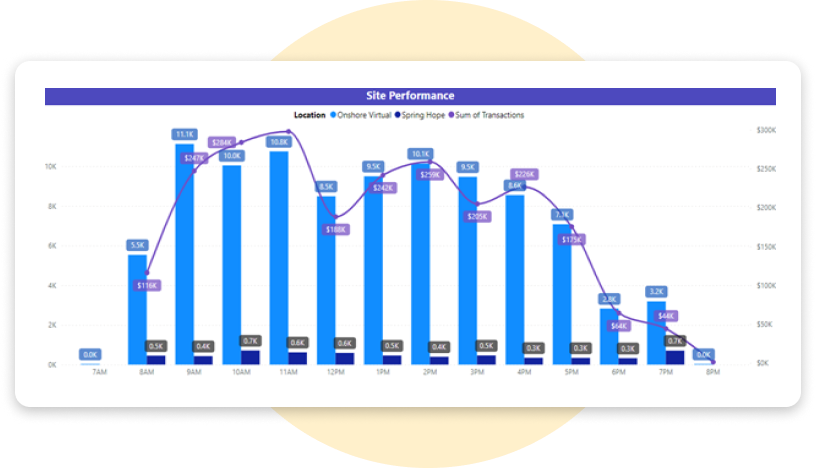
Smoothed line and clustered column chart
In Power BI charts, the Smoothed Line and Clustered Column Chart stands out, combining column data precision with smoothed lines for clarity and insight.
Drilldown
Drilldown functionality is used in the charts to go further into the specifics of the data. This function enables users to navigate hierarchical data layers, uncovering hidden patterns and insights beneath the surface.
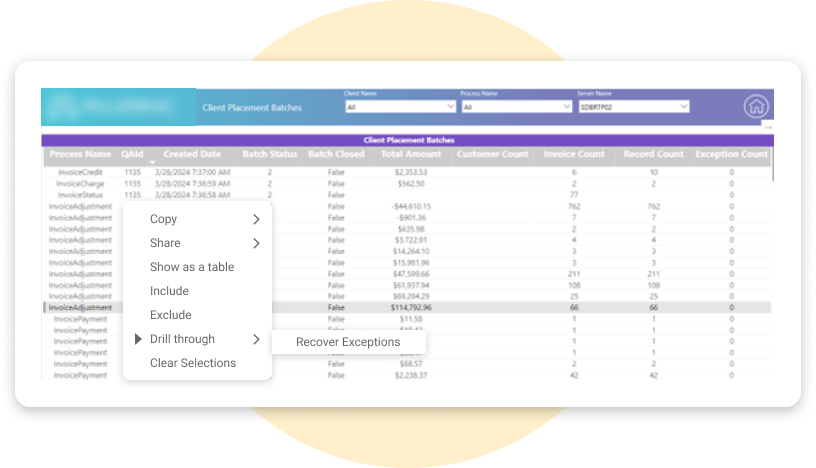
Drill through
Drill-through functionality is used in the charts to provide a seamless transition across pages for further insights. This feature simplifies navigation in Power BI reports into related data points.
Page navigation
Client uses page navigation which facilitates speedy navigation to the target page.
Filters
Data visualization potential is maximized in client Power BI charts with the versatile use of page-level filters, report-level filters, and visual-level filters.
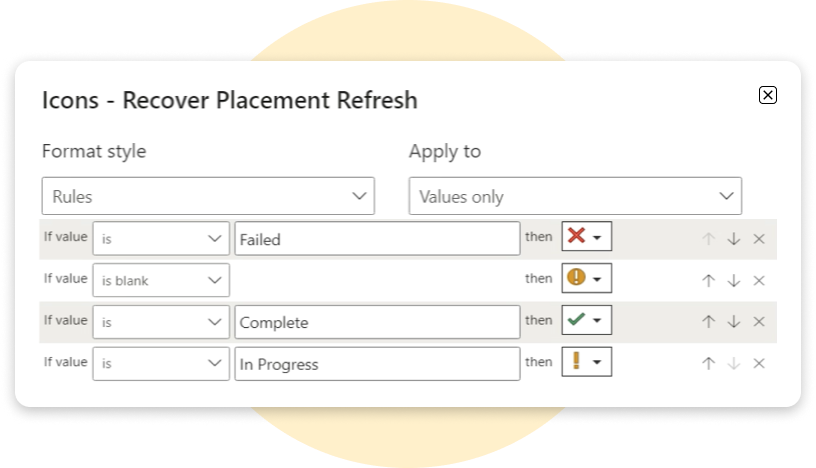
Conditional formatting
The use of conditional formatting techniques improves the informational value of the data presented in the charts. This makes it possible for users to immediately recognize patterns.
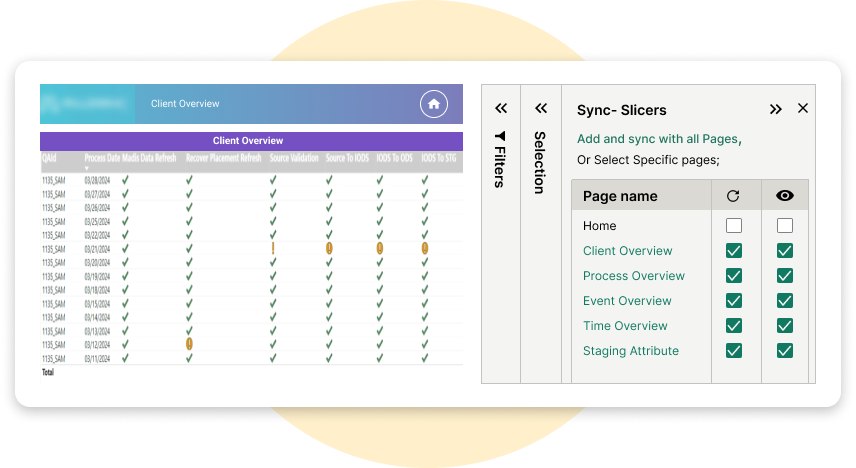
Sync slicers
To maintain consistency in data analysis, client's reports make full use of Sync Slicers capabilities so that users can study and compare data from various perspectives.
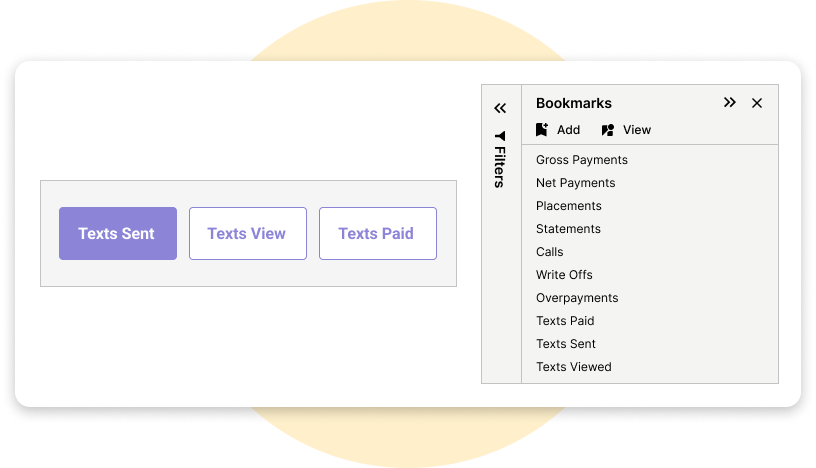
Bookmarks
To display the data visually without switching tabs, dynamic bookmarks are utilized to alter the views within the tab.
Explore more.
Additional features.
More styling options for column and bar charts. These amazing improvements have been designed meticulously to greatly improve your data visualization skills and provide you with incredible storytelling capabilities.
Expanded data label customization. Discover Enhanced Data Label Capabilities for Seamless Customization and Integration of Additional Metrics, Elevating Your Data Analysis Experience.
Horizontal conditional format. Client used horizontal conditional formatting to represent the range of the clients on a weekly basis.
Export preferred charts/KPIs. Client Power BI reports can be exported in the form of Excel, PowerPoint, PDF


