Enhancing E-Commerce Performance with Data-Driven Dashboards.
- Industry: eCommerce
- Country: Netherlands
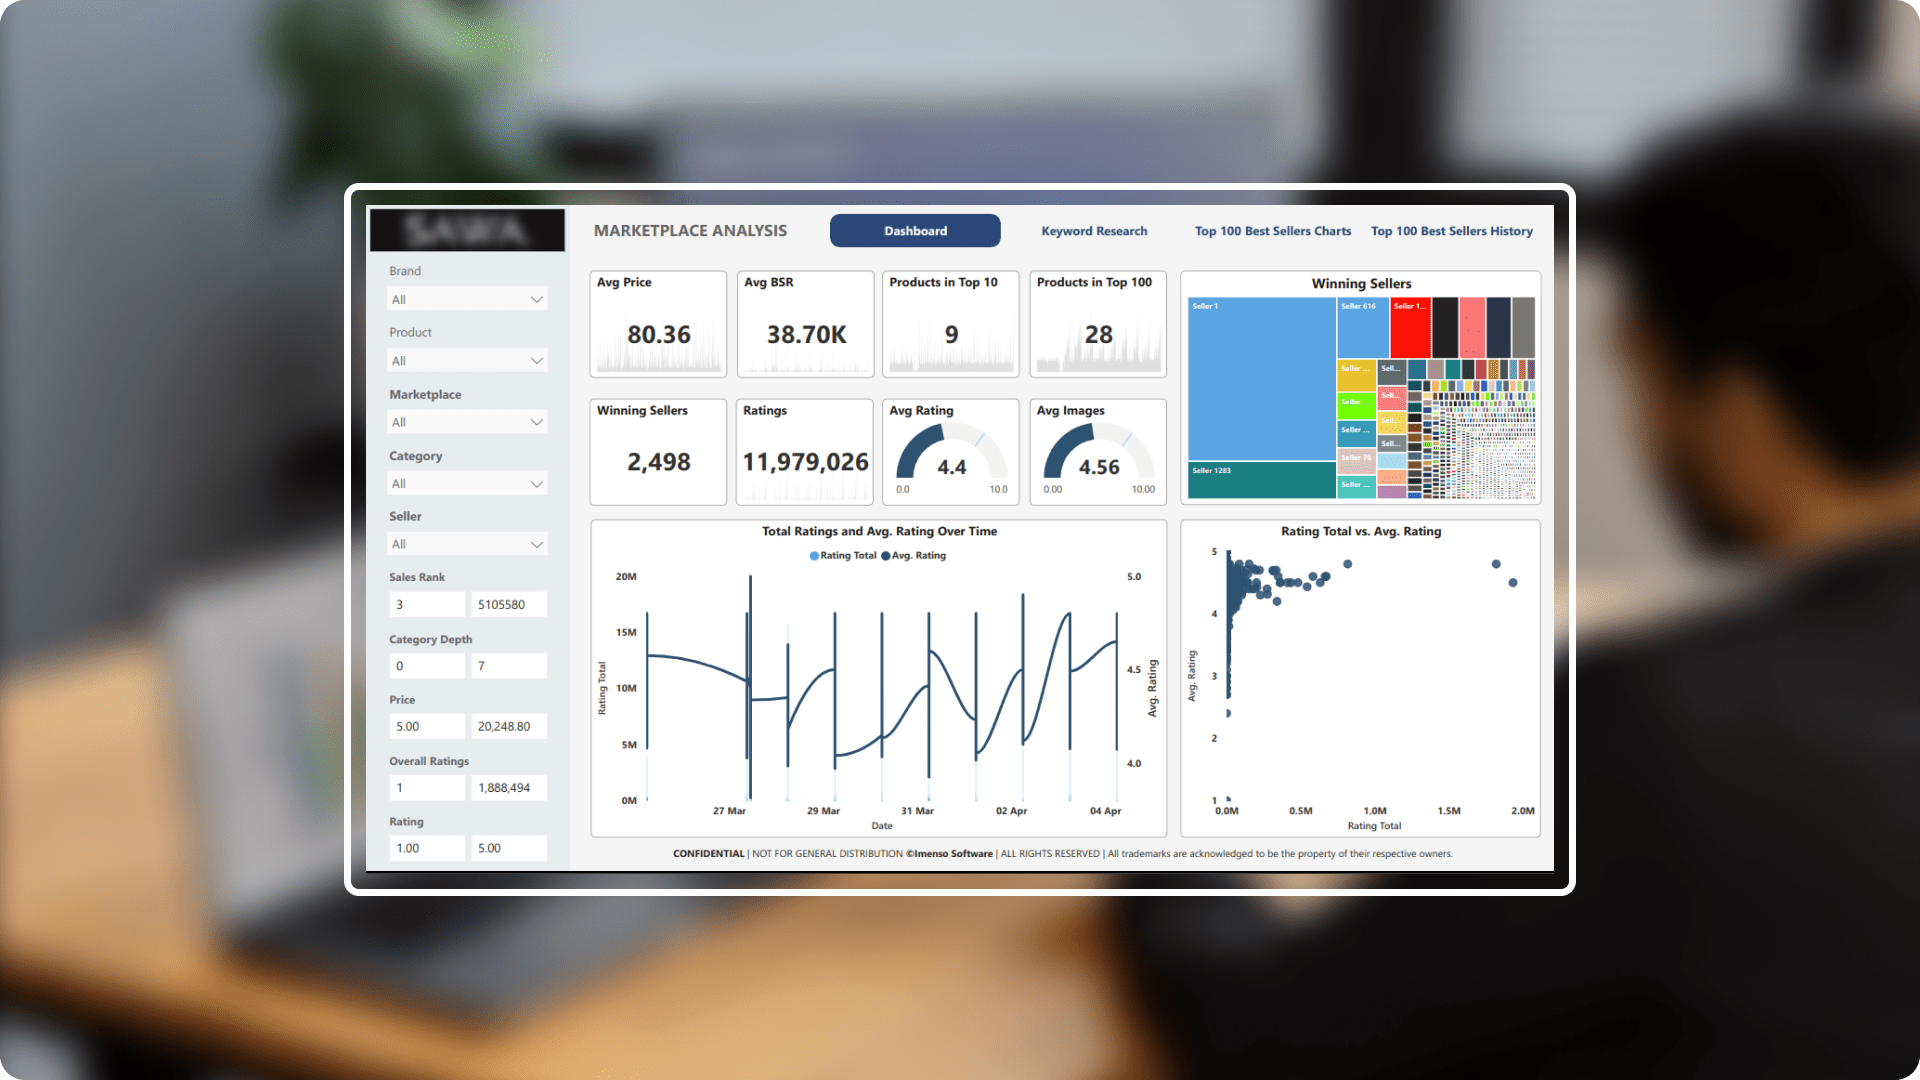
The goal of this dashboard is to provide strategies and approaches for successfully running the Amazon marketplace. With the help of this dashboard, business owners can make informed decisions to overcome the competitive e-commerce environment and see notable growth and success on the platform.
The core challenges
- Data integration and consolidation: A large amount of data is generated by Amazon Marketplace, such as sales, customer, and inventory data. This data must be combined for analysis from various sources and formats, such as Seller Central, the Marketing API, and Fulfillment by Amazon (FBA).
- Real-Time visibility: It is critical to keep an eye on the dashboard's key performance indicators (KPIs) in real-time. This includes data straight from Amazon Marketplace, such as units sold, price, ratings, category, search term, and customer reviews. To do this, effective data refresh strategies are necessary.
- Sales performance analysis: Determining the complex relationships between different metrics, such as ASIN, category, price, and sales volume, is necessary for analyzing sales data. So, to solve it, we do data modelling.
- Competitive analysis: To identify patterns and opportunities for business, keep an eye on competitors' pricing, rankings, and other performance metrics. This requires sophisticated data analysis techniques for which we create comparative analysis visualization.
Solution We solved performance problems from slow data retrieval, and we adapted data modelling to specific needs of the business. To tackle the fundamental issues of choosing dynamic data parameters and customizing charts when creating an e-commerce business intelligence dashboard, we came up with the following fixes.
-
 Enhanced data visualization: Specific pages that display best-selling items, goods, marketplaces, categories, etc. according to different metrics like cost, volume, rank, and rating.
 -
 Data access configuration: Enable selective data retrieval based on predetermined lookback days by setting file settings to optimize data accessibility, guaranteeing accurate and timely insights.
 -
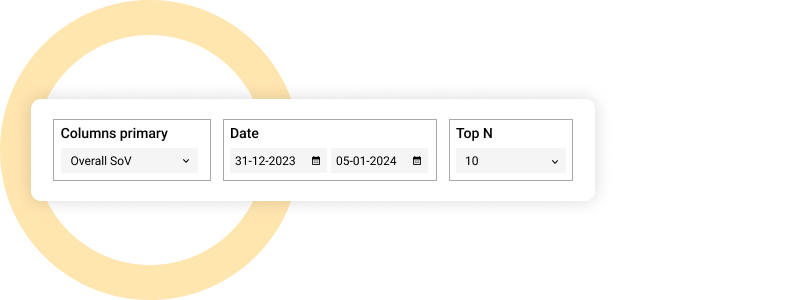
 Streamlined data filtering: By applying field parameters and numeric range parameters, you can streamline data analysis and make it easier to filter data across pages for more targeted and useful insights.
 -
 Embedding report: This enables Our clients to easily incorporate interactive reports and dashboards into your applications, client portals, and websites. Users can now explore and analyze data directly within your app, saving them the trouble of switching between platforms and promoting a more seamless user experience.
 -
 Comparative evaluation: Enable slicer selections for the current year, month, and quarter, as well as the corresponding periods from the prior year, to facilitate comparative analysis. Help in complete evaluation and decision-making by offering insights into long-term performance trends.
Integration.
Equipped with a variety of supply chain data.
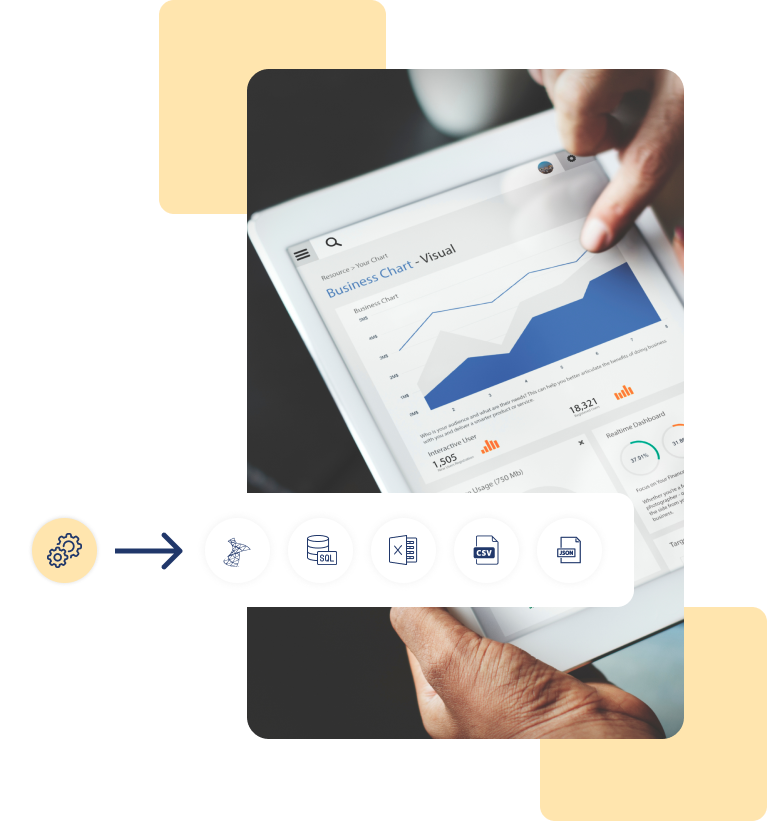
This integration process simplifies analysis and visualization by combining data from several sources into a single, coherent file. Harmonizing data from various platforms is part of the integration process, and it includes:
- SQL
- My-SQL
- Excel
- CSV
- JSON
- Google BigQuery
Customization.
How we played with charts?
We have made a number of modifications to our Power BI report in order to give users more intuitive data exploration and deeper insights.
Data-Driven visual enhancements
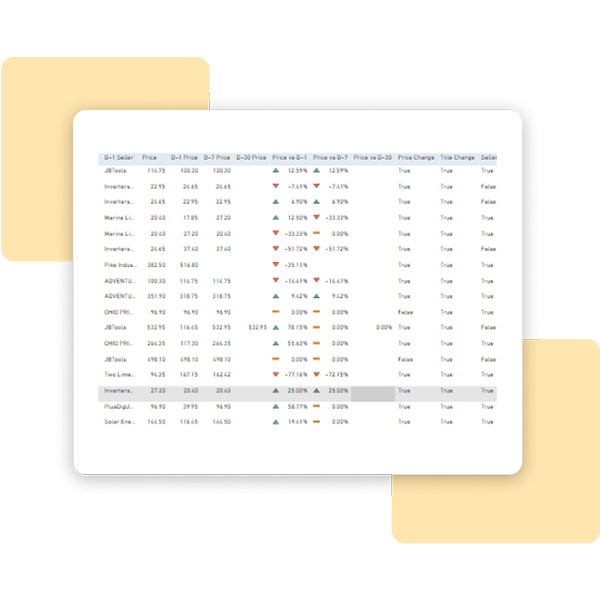
To dynamically highlight important trends, we added conditional formatting across several columns. In order to facilitate quick decision-making, icons are strategically used to quickly identify areas of sales growth or decline.

Word cloud analysis for keywords
By utilizing the word cloud chart, we provide a visualization of keyword frequency, which helps identify terms that are searched for more frequently. This feature offers insightful information about the preferences and interests of consumers.
Simplified parameter visualisation
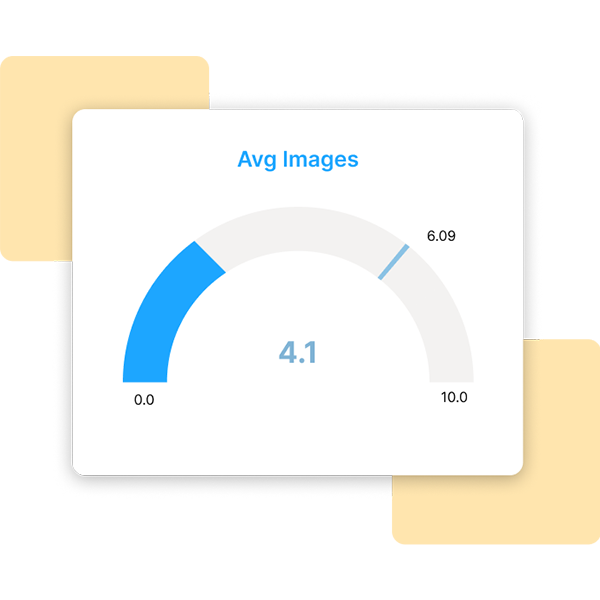
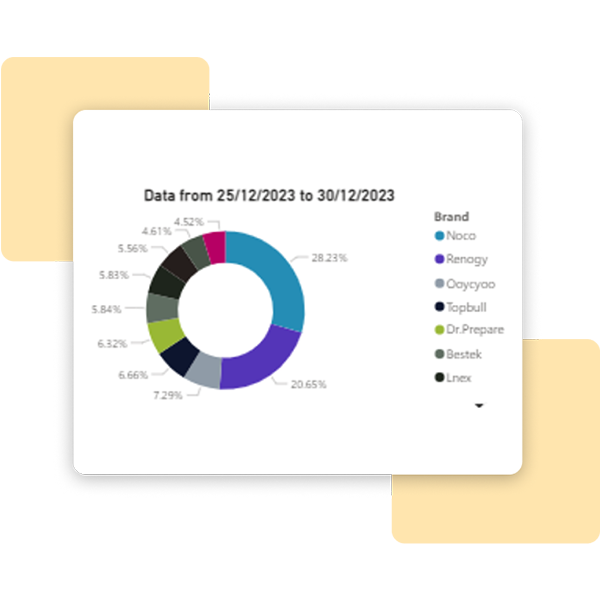
To make a variety of parameters, like average rating, price, and rank, easy to understand, our report includes gauge charts. Key metrics are presented in a simple way that improves understanding and helps with strategic planning and analysis.
Dynamic headings based on filters
We customized the report's headings to change dynamically based on filter selections in order to fulfill a range of analytical needs. By doing this, users are sure to receive useful and relevant data that is suited to their individual needs.
Enhancement.
By adding useful features.
We have incorporated several features in this dashboard to improve functionality and user experience.
Page navigation
Use buttons to facilitate chart navigation.

Top N
To make data more visible and to give visual charts a "Top N" function. This allows users to focus on the top N items based on predefined standards.
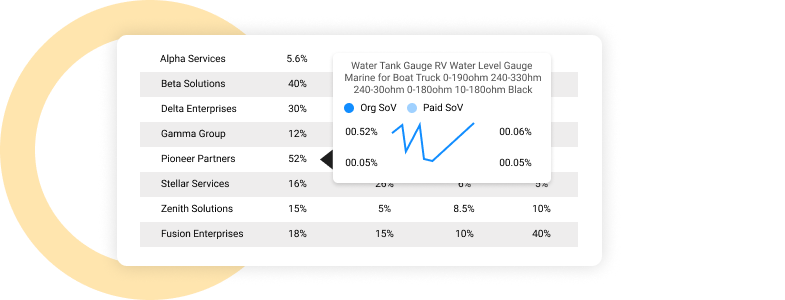
Tooltip
Provide contextual information and tooltips to aid users in understanding button operation.
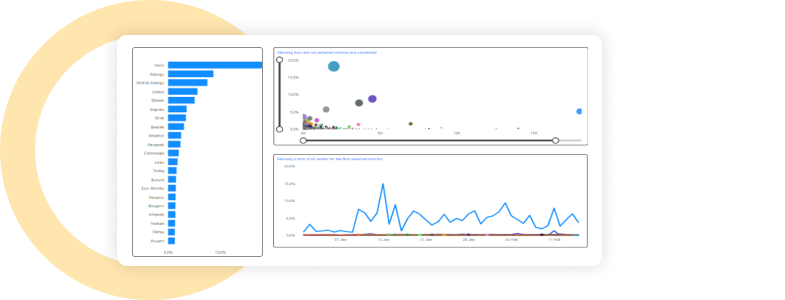
Dynamic visualisation techniques
Adding various chart types, such as word clouds and scatter charts, improves the dashboard's appearance and enhances the user's immersive and engaging experience.
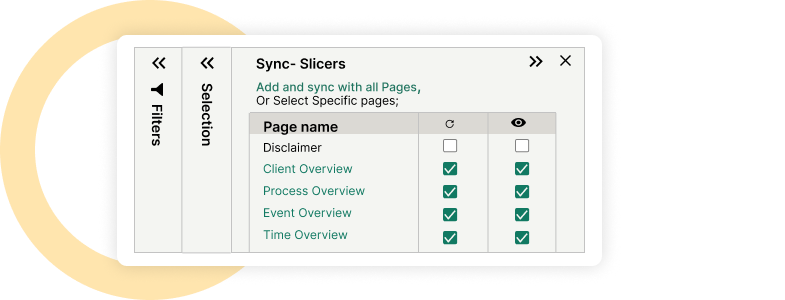
Sync slicer
Used sync slicer functionality to allow user to apply the same filtering across different pages simultaneously, consistency and unified viewing experience.
Explore more.
Additional features.

Single Sign-On (SSO). Installed an integrated Single Sign-On authentication system, enabling users to log into several applications with just one set of login credentials.
Enhanced data integration strategy. We optimized data import in Power BI using a smaller dataset and integrated real-time data from SQL. To address limited columns in our views, we employed a composite model combining two datasets, ensuring efficient operations and easy integration of new data.


