Elevating Performance Strategies with Advanced Data Visualizations.
- Industry: Food and Beverage (F&B)
- Country: Dubai
The primary objective of creating this dashboard is to monitor various aspects such as sales performance, inventory management, customer preferences, and supply chain logistics. By tracking key performance indicators (KPIs) such as sales revenue, inventory turnover, customer satisfaction scores, and supplier performance metrics, the dashboard enables stakeholders to make informed decisions and optimize business processes.
The core challenges
- Data variety: Food and beverage companies deal with a wide range of data types including sales figures, production data, supply chain information, customer feedback, quality control metrics, and regulatory compliance data. Utilize the Power Query Editor to transform and cleanse raw data from various sources before loading it into Power BI datasets.
- Supply chain complexity: The food supply chain is complex, involving multiple stages from sourcing raw materials to manufacturing, distribution, and retail. Implement data pipelines to automate the extraction, transformation, and loading (ETL) of supply chain data into Power BI datasets on a regular basis.
- Seasonal demand: Seasonal fluctuations in demand are common in the food and beverage industry due to factors such as holidays, weather patterns, and cultural events. Power BI to build predictive logic that forecasts future demand based on historical trends and external factors.
- Competition and market trends: The industry is highly competitive, with rapidly changing consumer preferences and market trends. Integrate market research data and competitor analysis into Power BI to identify emerging trends and consumer preferences.
- Customer engagement and loyalty: Building and maintaining customer loyalty is crucial for success in the food and beverage industry. Implemented personalized marketing campaigns based on insights derived from customer data analysis within Power BI.
- Data quality and integration: Data quality issues such as inconsistency, incompleteness, and inaccuracies are common in large datasets. Utilize data profiling and cleansing capabilities in Power BI to standardize data formats, remove duplicates, and enhance data quality before analysis.
- Adaptable heading and data values: Implementing dynamic changes in headings and data values based on filtering actions can be a difficulty. So, we have created measures to handle these dynamic adjustments effectively.
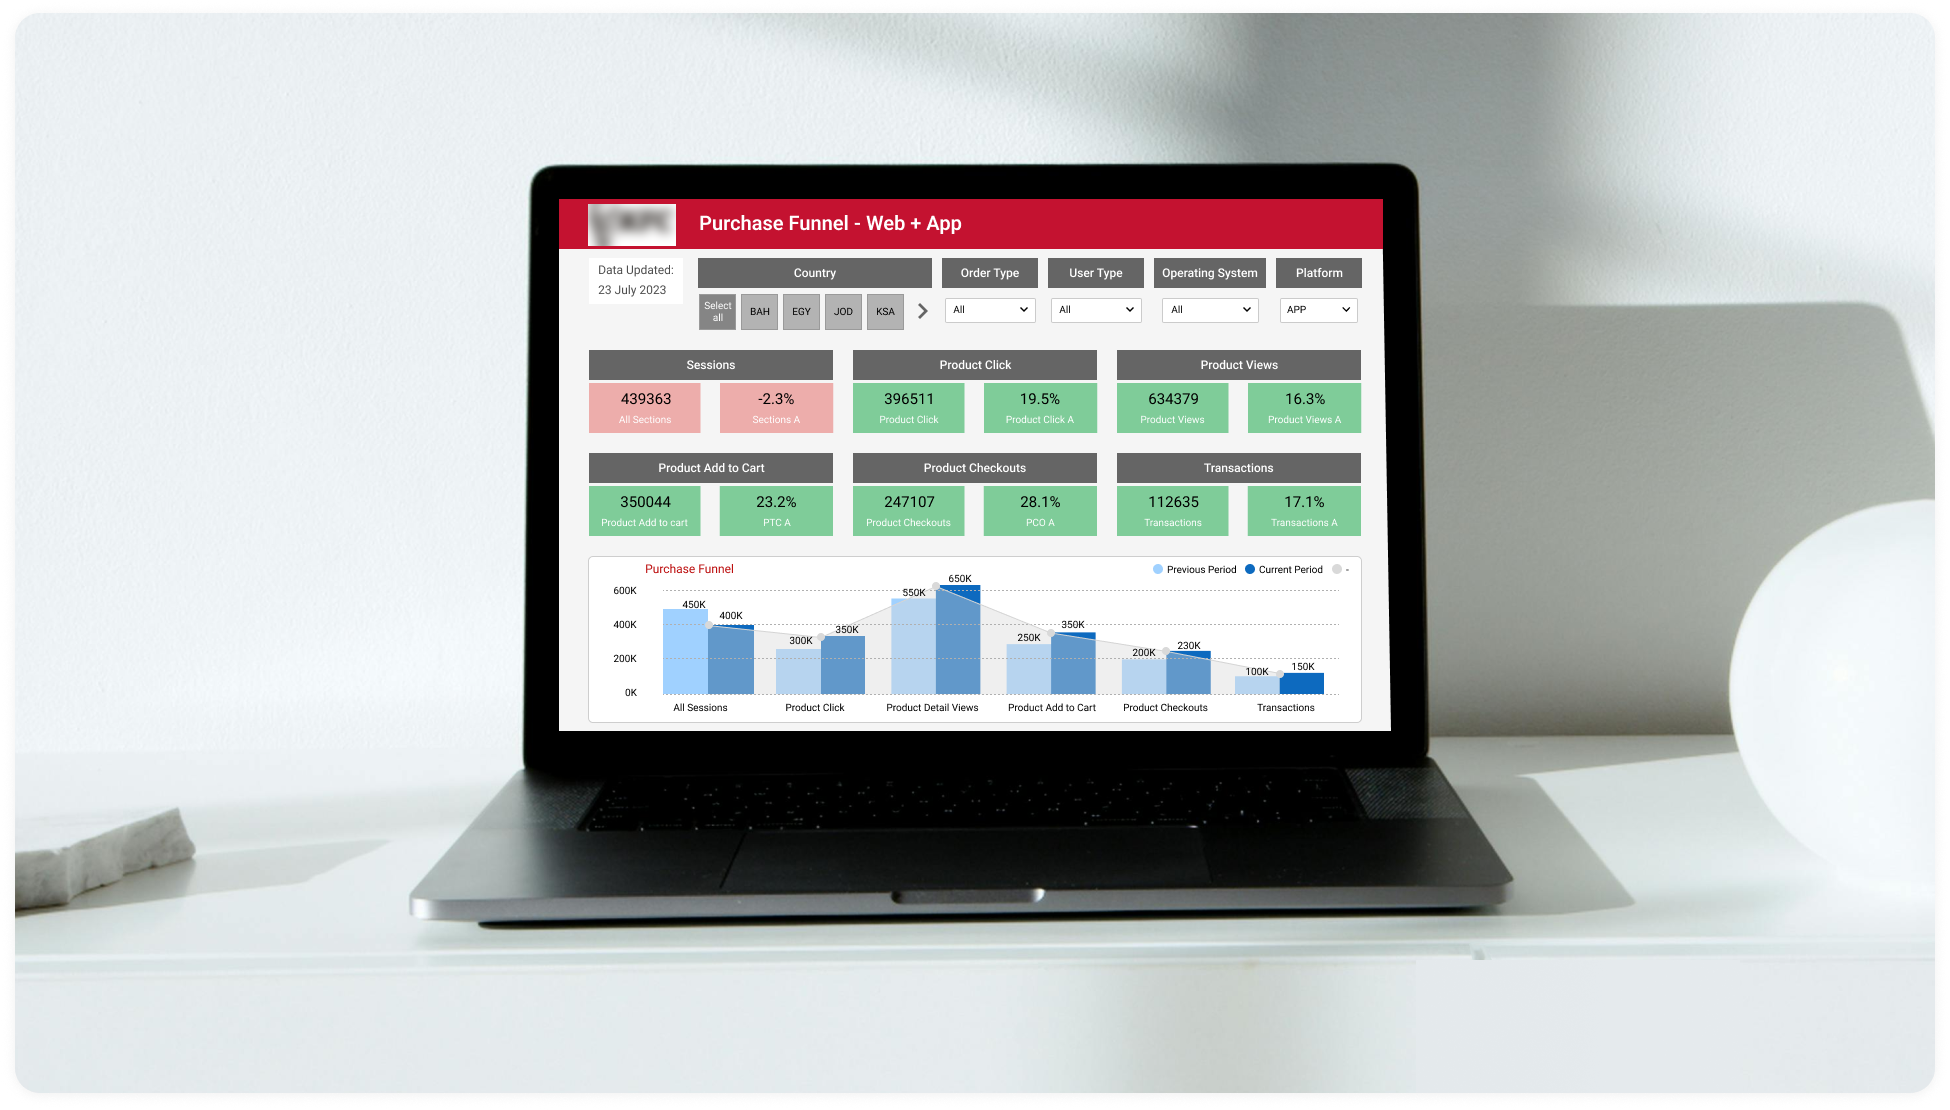
Solution We have developed an advanced data visualization tool tailored for the food and beverage industry, designed to represent complex operational data in an intuitive format. This tool is equipped with a diverse range of charts specifically curated to visually represent food and beverage data, offering improved clarity and facilitating easier interpretation for industry professionals.
-
 Data modelling: Modelling capabilities to structure and organize the integrated data for analysis.
 -
 Alert notifications: Created alert logic, which is in red and bold format, for any deviations from quality standards in real-time by using DAX.
 -
 Forecast seasonal demand: Built predictive models within Power BI to anticipate future demand based on factors such as holidays, weather forecasts, and promotional activities.
 -
 Market trends: Integrated market research data and competitor analysis into Power BI to identify emerging trends and consumer preferences.
 -
 Embedded the report: Embed the report into the web application, making it easily accessible and seamlessly integrated into the user's workflow. This empowers users to access and interact with the report directly within the application environment, enhancing usability and accessibility.
Integration.
Equipped with a variety of supply chain data.
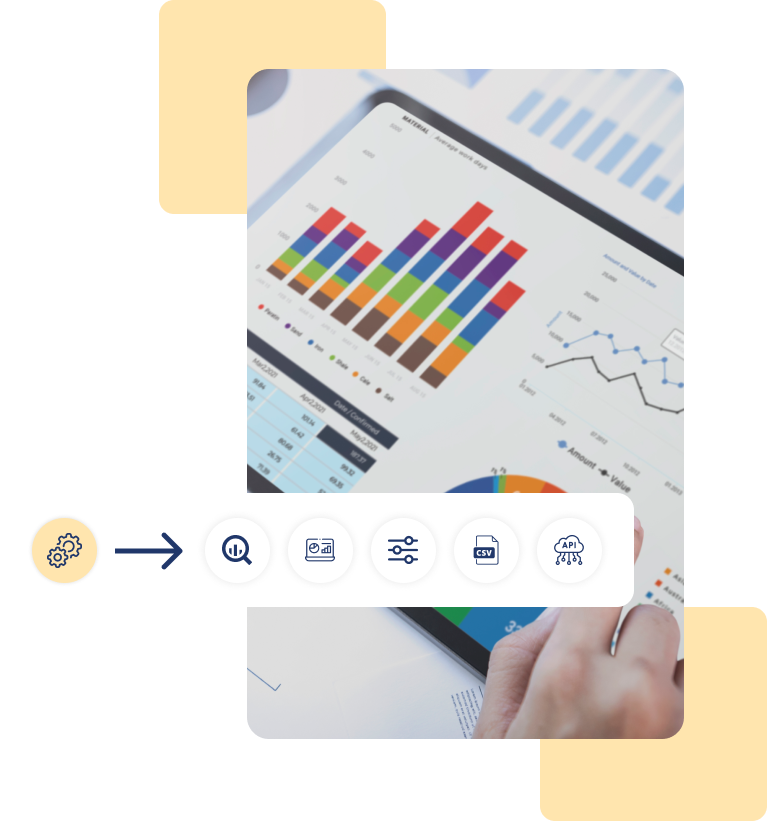
Integration in the food and beverage industry involves data from various origins, including inventory databases, point-of-sale applications, supplier APIs, or spreadsheets, and harmonizing them into a unified system. To create this report, we've leveraged the following integration capabilities:
- Google BigQuery
- Google Analytics
- Adjusts
- AdWord
- CSV and Excel Files
- Web APIs
Customization.
How we played with charts?
In crafting our data visualizations for the food and beverage industry, we didn't simply incorporate standard charts; we tailored them to uniquely suit the industry's needs. Each chart has been designed to enhance data clarity and relevance, ensuring that every visual representation serves its specific purpose effectively within the food and beverage sector.
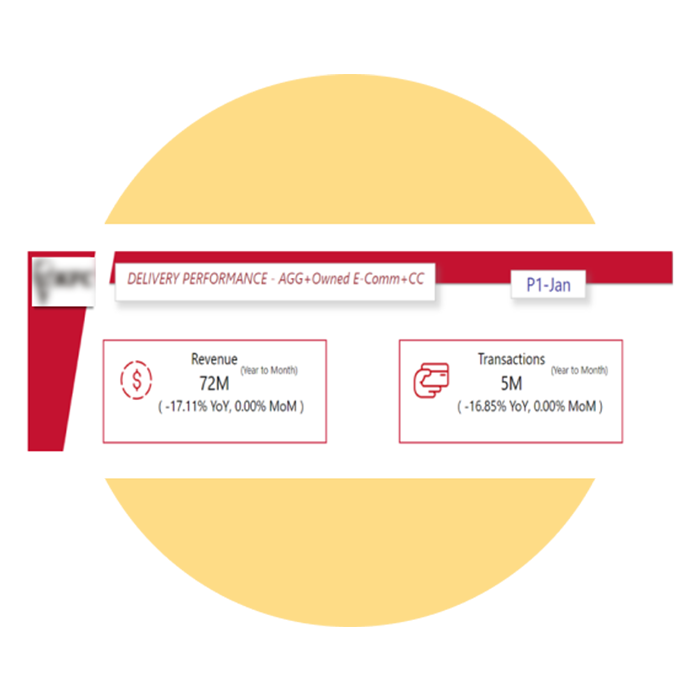
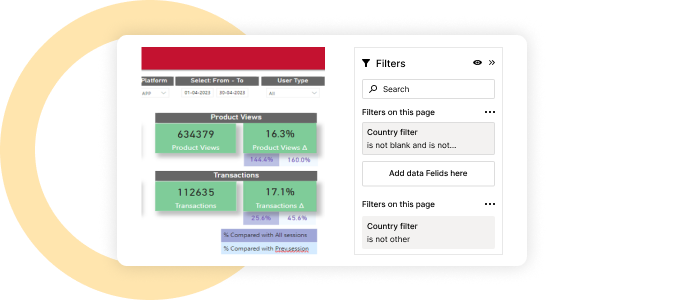
Custom card
To create a custom card, incorporate both text and multiple values, and add symbols for a unique design.
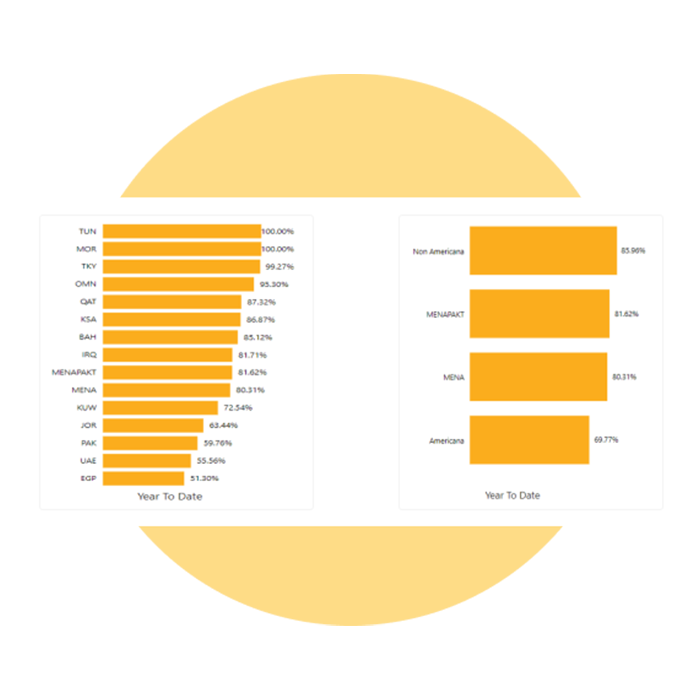
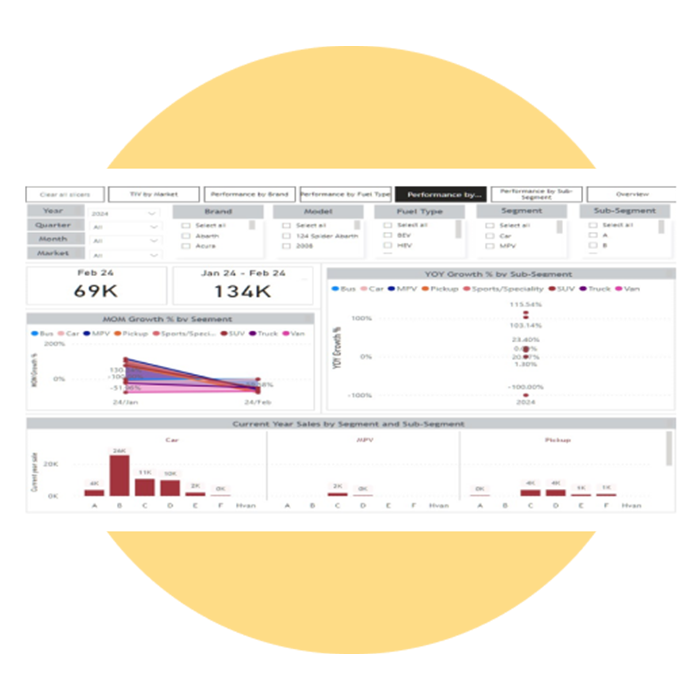
Drill-Down
In the bar chart, we have added hierarchy, wherein one axis represents countries, and within each country, clusters have been included.
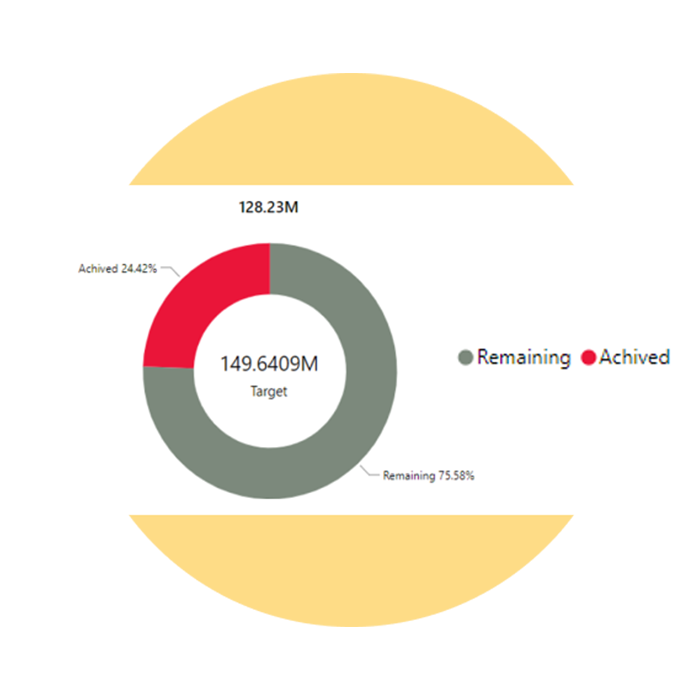
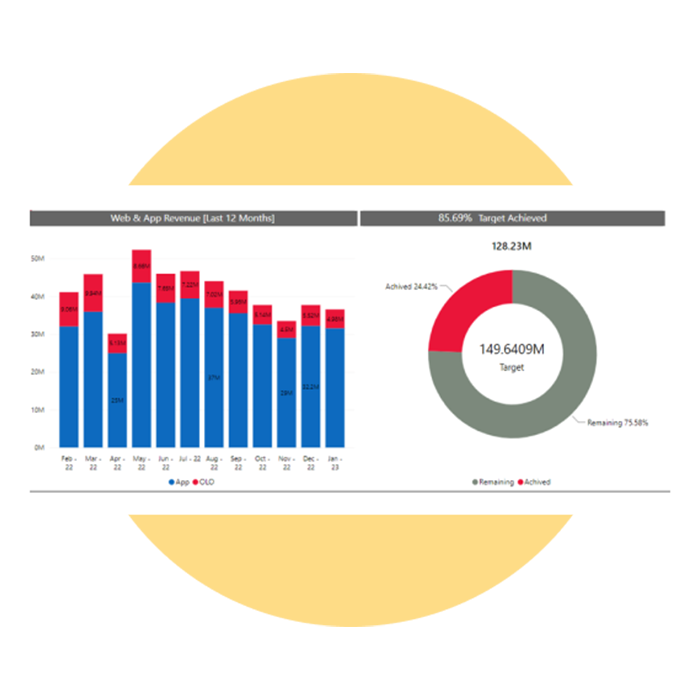
Custom donut
Created a donut chart featuring a target in the center and archived surrounding it, with the remaining fields appropriately colours.
Dynamic title
We developed a logic system to dynamically change the title based on various parameters or conditions, ensuring adaptability and relevance in different contexts.
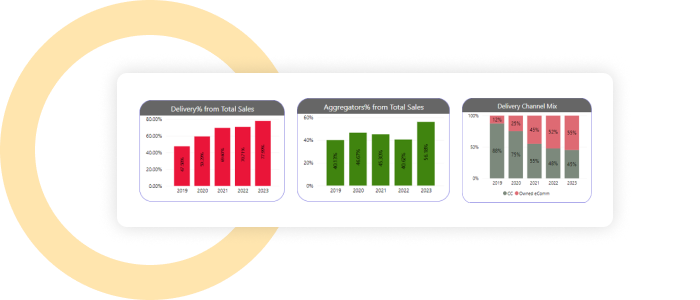
Using Theme-Based colours
We used theme-based colours in the report design to establish a distinctive visual identity, ensuring each visual stands out while maintaining consistency.
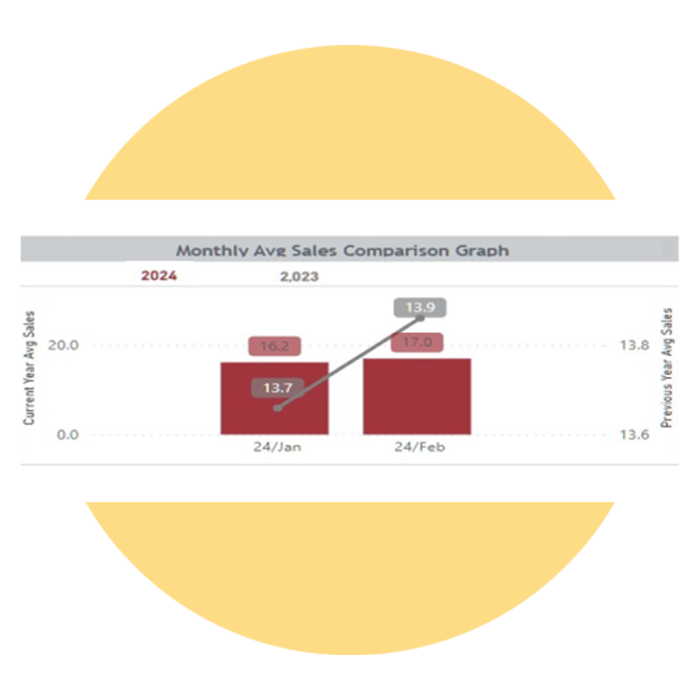
Simple data labeling for sales analysis
All the bar and column charts in the report have data labeling enabled to ensure that the current year's sales by segment and sub-segment are easily understood.
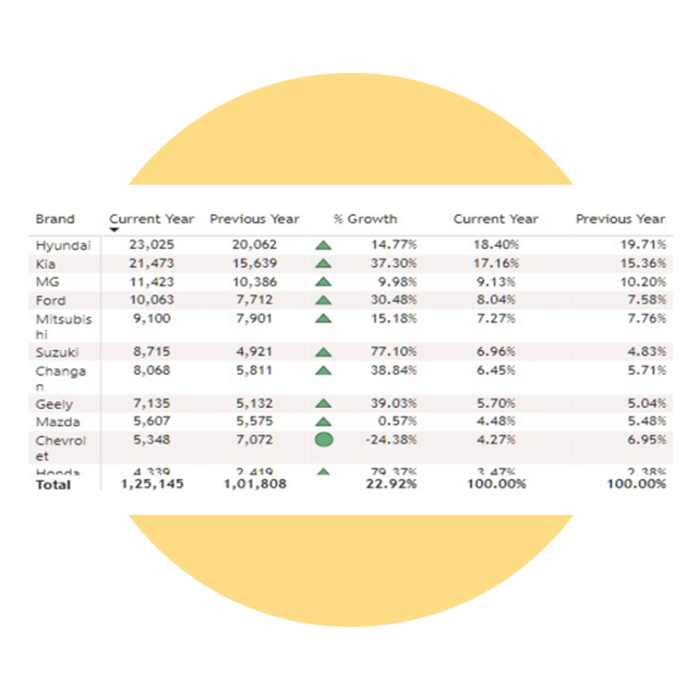
Formatting with Icon-Based identification
We have utilized conditional formatting with icon-based identification, including green triangles, yellow circles, and green circles, for easy % growth analysis.
Enhancement.
By adding useful features.
To enhance the functionality and user experience of our application tailored for the food and beverage industry, we've incorporated numerous features. These additions enable users to seamlessly interact with charts and data.
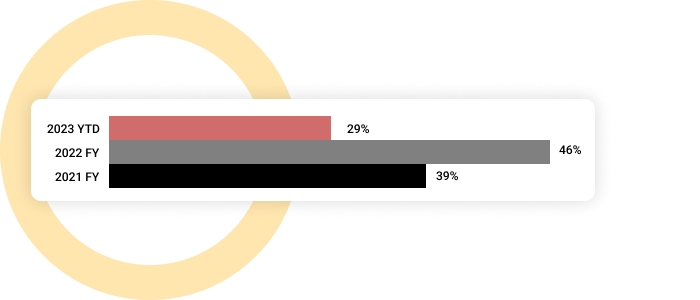
Disconnected calendar table
By connecting measures to the disconnected calendar table, calculate year-to-date totals for various sales.
Page and report level filters
Utilized both page and report level filters, filter pages and visuals according as per the requirements, ensuring a tailored viewing experience.
Customize shape of the visuals
We tailored the shape of the visuals to align precisely with specific requirements, ensuring they seamlessly integrate into the overall design aesthetic and effectively convey the intended message.
Flexible date showing with conditional layout
We have improved dynamic date representation by automatically displaying month-year based on specified periods using DAX measurements and conditional formatting on card visuals.

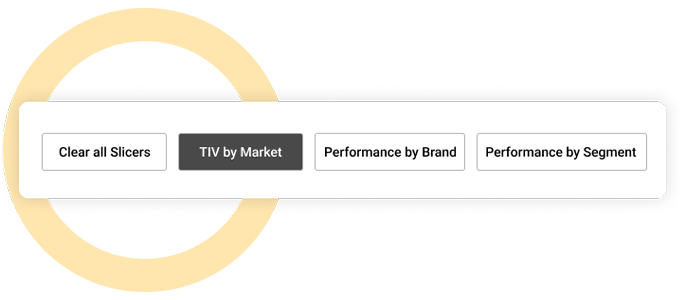
Integrated buttons
The buttons that match the tab titles have been utilized to display specific and identical information.
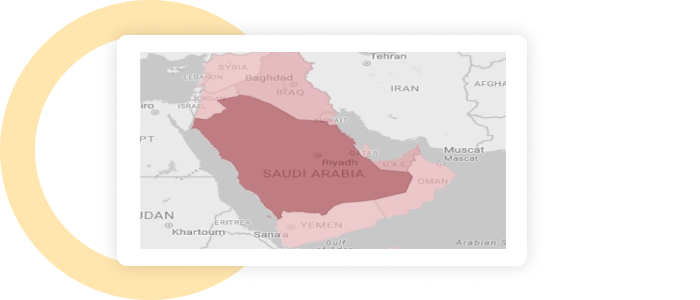
Using filled map
We used a filled map to visually represent the total number of public samples by country.
Explore more.
Additional features.
KPIs and objectives. Our Power BI report systematically evaluates and enhances the effectiveness, efficiency, and overall performance of food and beverage operations by seamlessly integrating a wide range of key performance indicators (KPIs).
Role-Based security. Used role-based security to limit user access to sensitive information and make sure they are only shown content that is important to their roles and responsibilities inside the company.
Modified formatting. Used conditional formatting techniques to dynamically highlight significant data points in complex datasets can improve understanding and clarity.
Unique theme. Created a distinctive custom theme that combined the brand's identity, making sure the UI was branded consistently all the way through.
Export preferred charts/KPIs. With the export feature, users can easily tidy up their data and save it.There are several methods to export a BI report. Here's a list of common export methods PDF, Power Point, Excel, CSV


