The objective of creating a business intelligence dashboard for the shipping industry is to equip professionals with actionable insights, streamline decision-making processes, and improve the overall efficiency of shipping operations through strategic utilization of data visualization and analytics.
The core challenges.
- Data integration: Shipping companies face challenges managing vast data. Historical data is downloaded from websites into CSV files and organized. An incremental refresh mechanism optimizes API data management.
- Real-time data processing: Realtime monitoring for efficient vessel planning, route optimization and cargo handling is needed in the context of shipping operations. For processing large real-time data creates aggregated data pipelines and efficient query.
- Predictive analytics: We utilize line chart forecasting, incorporating smoothed historical data to predict vessel performance, maintenance needs, fuel consumption, and arrival times. This is crucial for optimizing operations and reducing costs.
- Regulatory compliance: Shipping industry faces regulatory requirements concerning safety, security, emissions, and environmental protection. Incorporating regulatory compliance metrics in Power BI reports.
- Data security and privacy: For enhanced security, we implement Row Level Security (RLS) to filter sensitive data such as vessel positions, cargo details, and customer data based on specific criteria, ensuring confidentiality and protection.
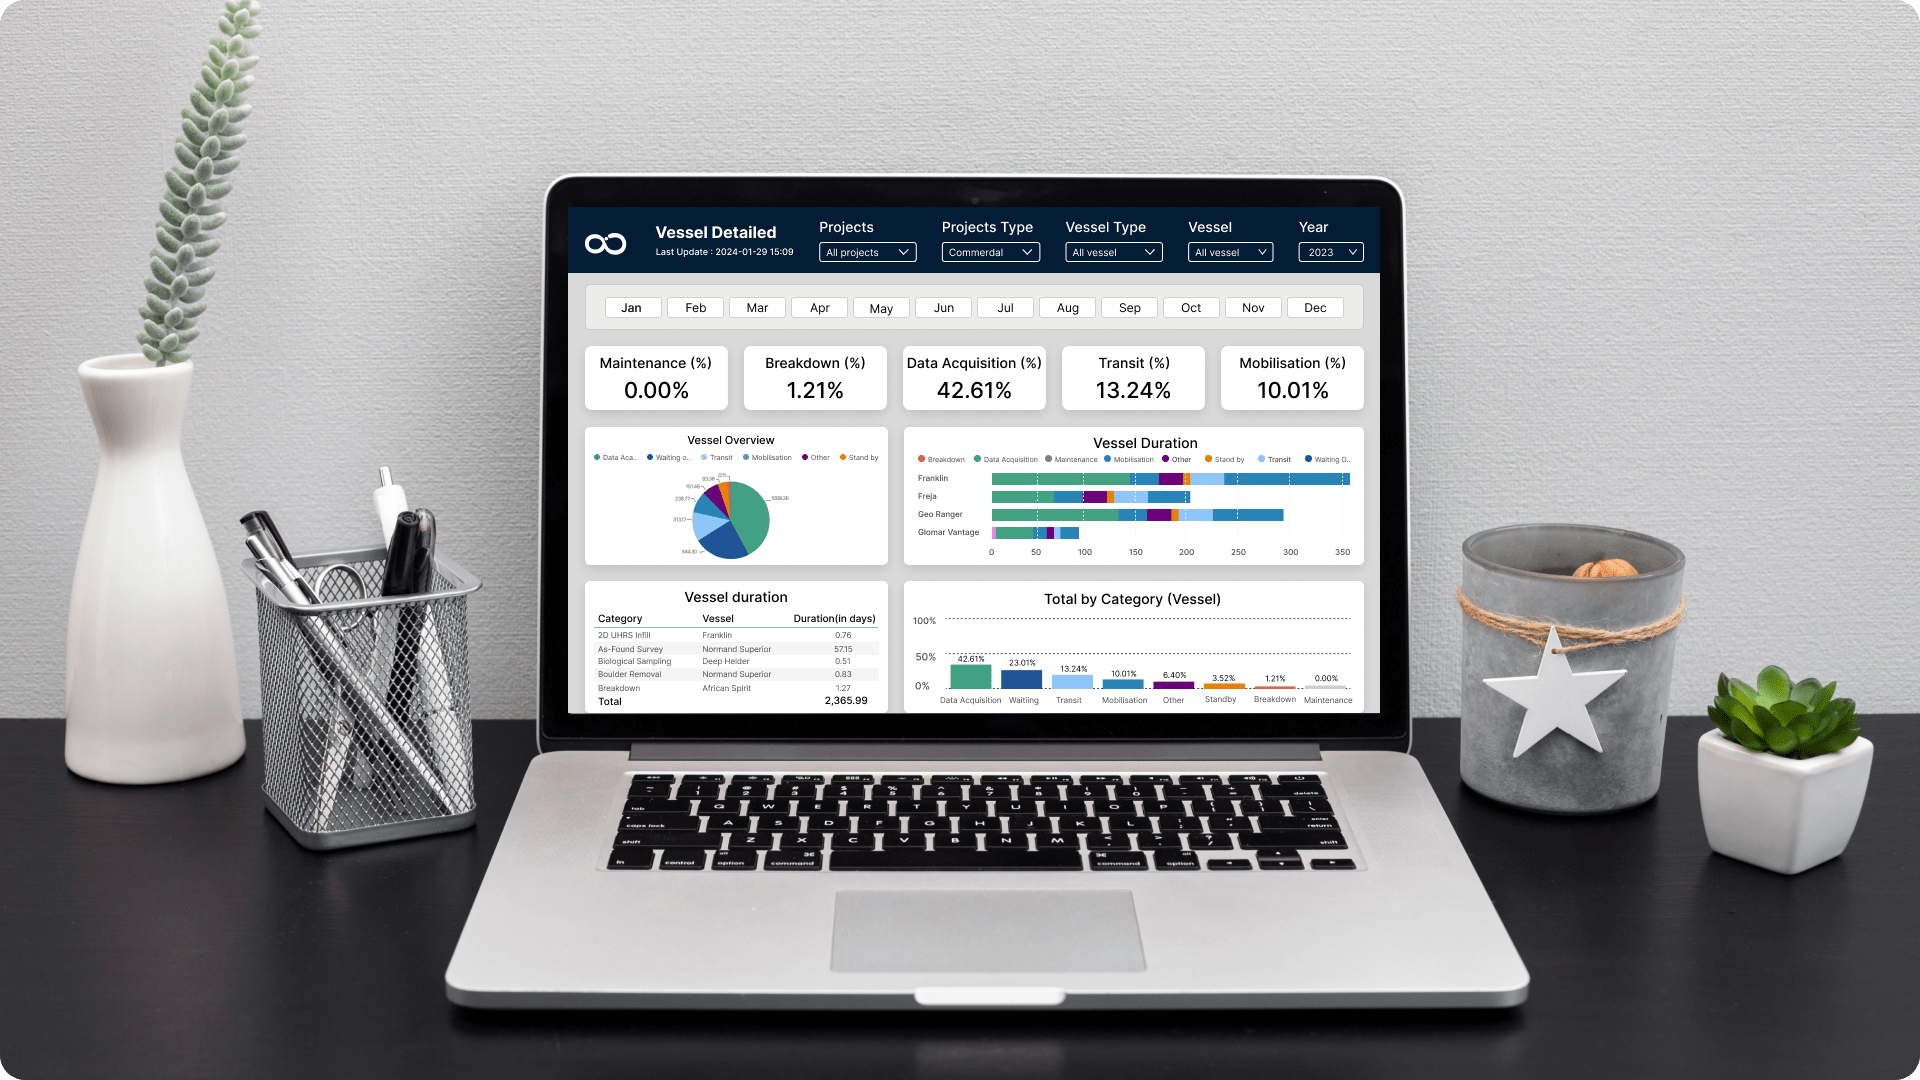
Solution We have developed an advanced data visualization tool tailored for the shipping industry, designed to represent intricate operational data in a user-friendly format. This tool is equipped with a versatile range of charts specifically curated to visually represent shipping data, providing enhanced clarity and facilitating easier interpretation for industry professionals.
-
 Data integration with incremental refresh : Historical data is downloaded from relevant websites into CSV files and organized into a separate folder. An incremental refresh mechanism is enabled for API data, this approach optimizes data management, ensuring a balance between timeliness and stability.
 -
 Predictive analytics with line chart: To predict vessel performance, maintenance requirements, fuel consumption, and arrival times, we utilize a line chart forecasting feature. This feature incorporates smoothed historical data to generate accurate predictions.
 -
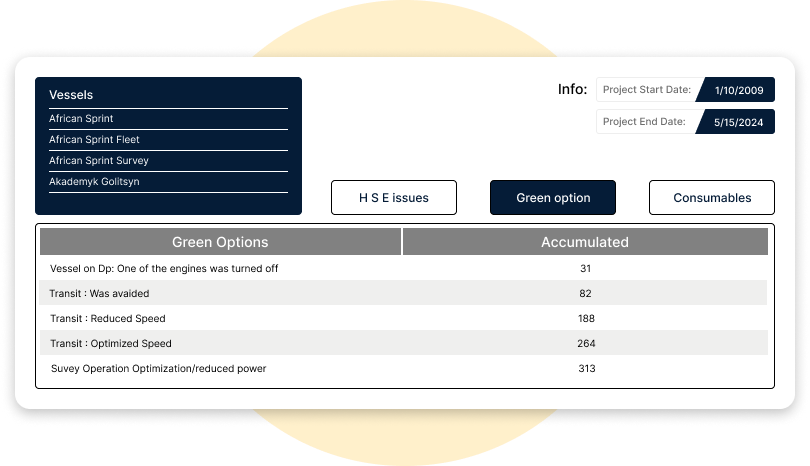
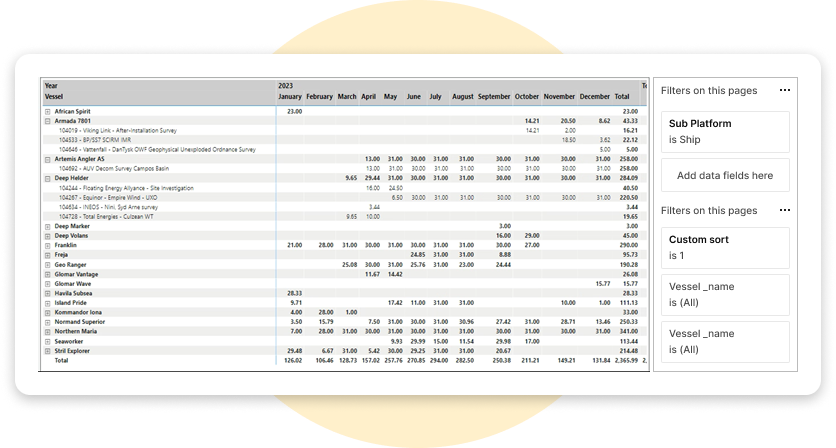
 Filters and slicers: Filtering and slicing data to focus on specific subsets of information within reports and dashboards.
 Row level security: For enhanced security, we implement Row Level Security (RLS), which involves filtering data based on specific criteria.
 Embed reports: Embed reports and dashboards into custom applications or websites for broader consumption.
Integration.
Equipped with a variety of
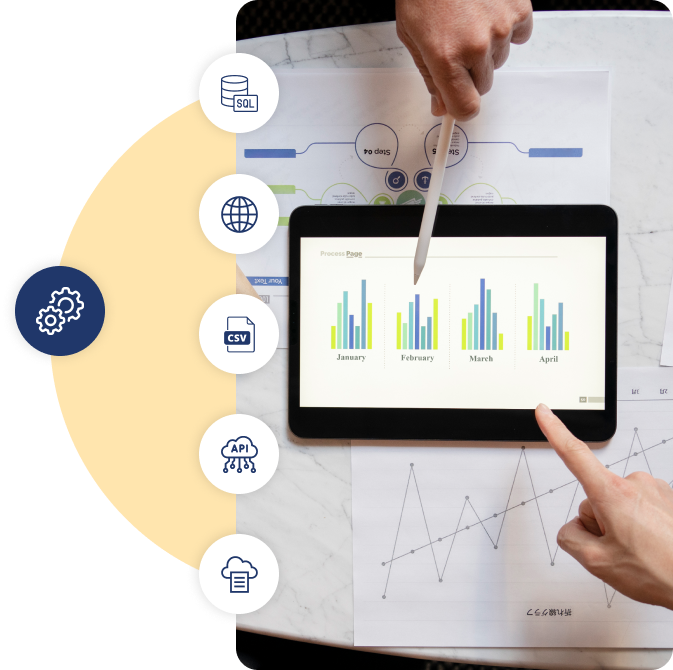
data source.Integration enables organizations to streamline processes, improve data accessibility, enhance decision-making, and create more efficient workflows. To create this report, we've leveraged the following integration capabilities:
- SQL Server
- Web
- CSV files
- External sources like APIs or web services
- Shared Cloud Storage
Customization.
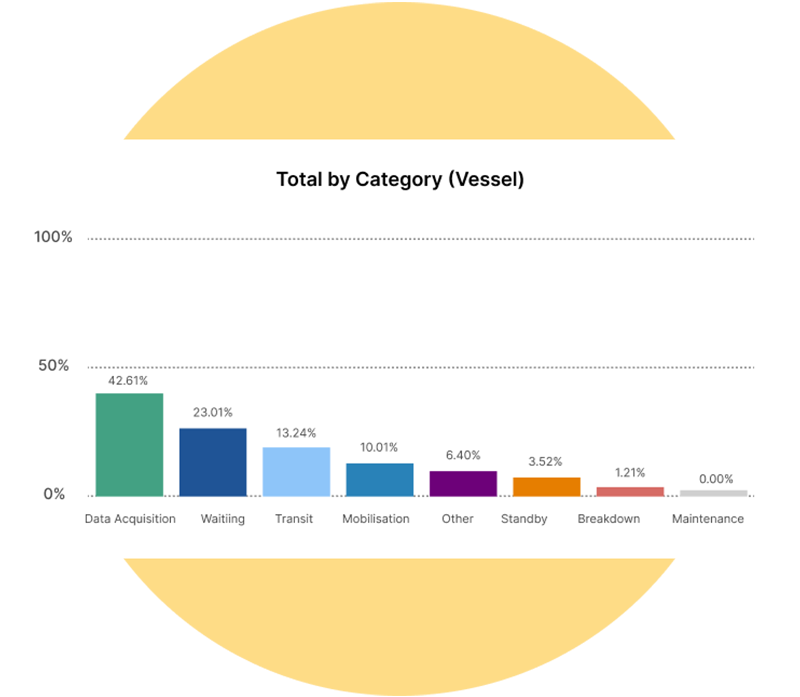
How we played with charts?We didn't just add the charts; we made them special to show data better, making sure each chart looks just right for its purpose.
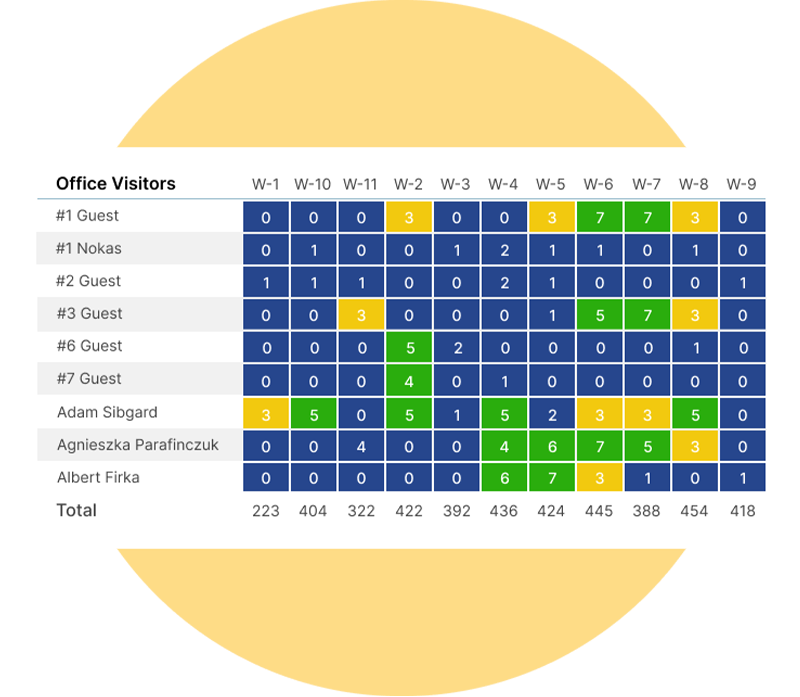
Condition formatting
Dynamic modifications such as changing the background colors of rows based on specific conditions.
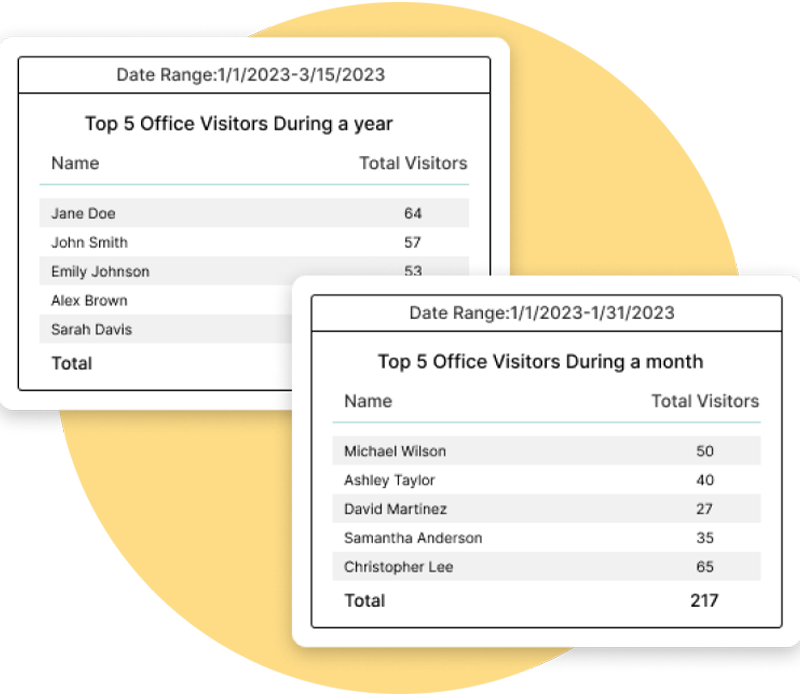
Top filter
Offered insights into top clients for both the current period and overall period.
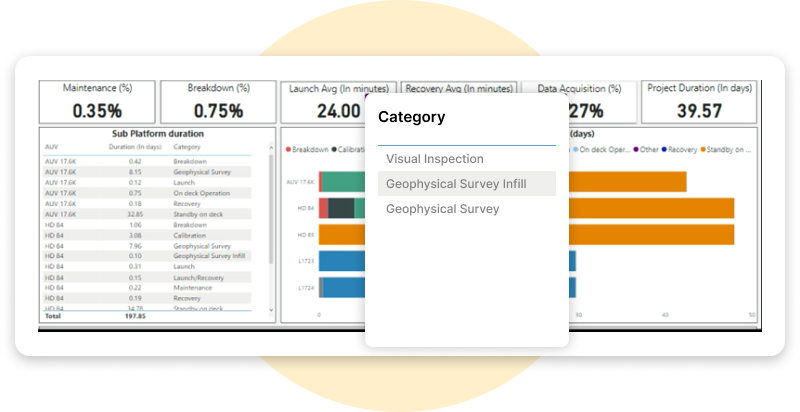
Drill-down
Incorporated hierarchical structures into drill-down functionalities for enhanced understanding.
Page navigation
Provided seamless page navigation with filter application to navigate through selected data subsets.
Enhancement.
By adding useful features.We have included a lot of features to make the app more user-friendly.These features allow you to easily manipulate the data and visualizations.
Bookmarks
dynamic chart views through bookmarks, enabling users to seamlessly switch between different chart representations based on the selection of actionable buttons, all within the same canvas.
Tooltips
Tooltip have been strategically utilized to provide detailed analysis information, maintaining proper filter context for enhanced insights.
Page and report level filters
Utilized both Page and Report Level Filters, users can now filter pages and visuals according to specific requirements, ensuring a tailored viewing experience.
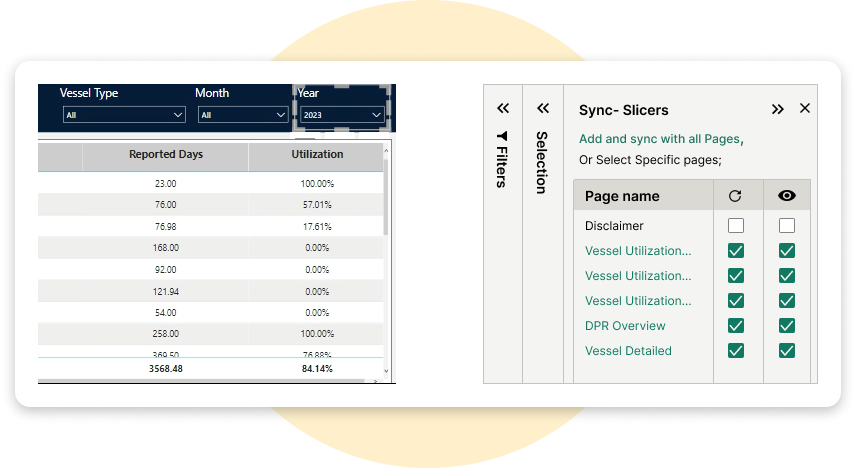
Synchronizing slicers
Synchronized slicers across all pages, users can effortlessly navigate through the data while maintaining consistent filtering across different visualizations, facilitating a cohesive analytical journey.
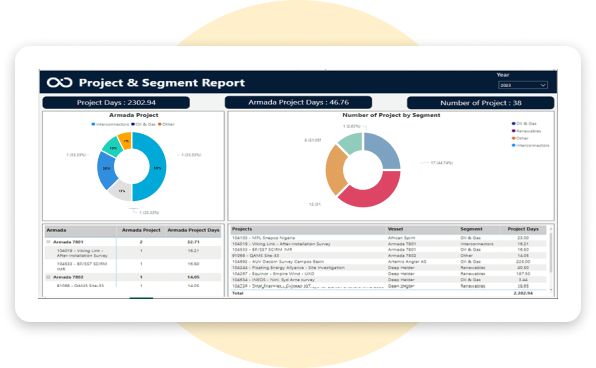
Embedded the report
Embed the report into the web application, making it easily accessible and seamlessly integrated into the user's workflow. This empowers users to access and interact with the report directly within the application environment, enhancing usability and accessibility.
Explore more.
Additional features.
Implementing Scheduled Data Refreshes.This report's implementation of schedule data refresh ensures that the shipping information is regularly updated, maintaining its relevance and accuracy over time.

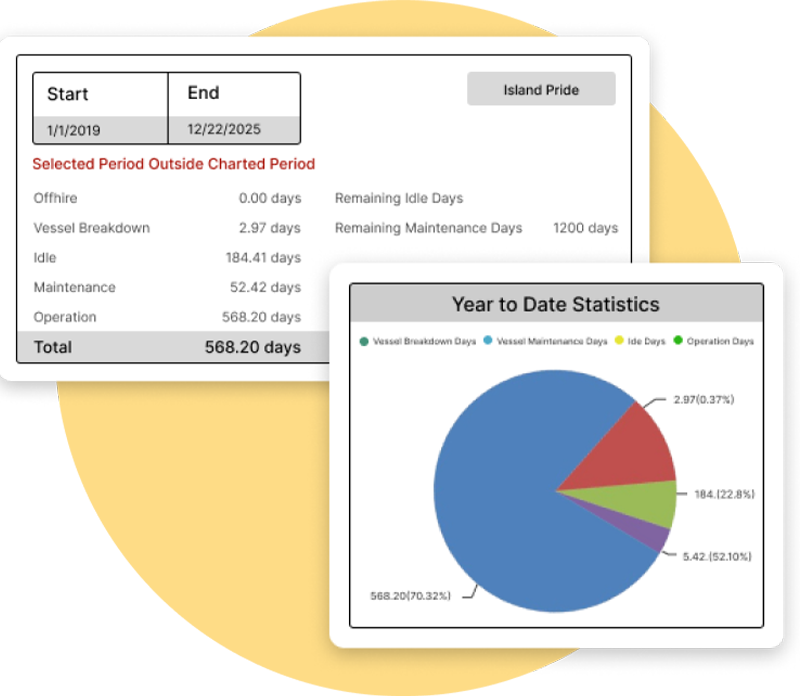
Key Performance Indicators.Incorporated a diverse array of Key Performance Indicators (KPIs) tailored to systematically assess and boost the efficiency, effectiveness, and overall performance of shipping operations.

Customized UI. To enhance accessibility and functionality for the shipping industry, it was necessary to refine the visual layout, incorporating intuitive navigation components and optimizing interactive features for smoother user engagement.

Export preferred charts/KPIs. With the export feature, users can easily clean up their data and save it. There are several methods to export a BI report. Here's a list of common export methods. PDF, Power Point, Excel, CSV, Web, Service API
Looking to build similar
solution for your business?
We have all the required expertise to help your business grow
I would like to..


