The goal of developing a business intelligence dashboard for office furniture makers is to provide executives with insightful information so they can make wise decisions and boost revenue growth and we made it user friendly so that the client obtain vital information, they can easily see the trends, evaluate performance indicators, and react quickly to changes in the market.
The core challenges.
Resolving issues with delayed data delivery and customizing data modelling to fit specific business needs.
- Legacy system replaced with bI: A move towards more dynamic, interactive, and data-driven reporting and analysis is represented by the switch from SSRS to Power BI, enabling enterprises to extract more value from their datasets.
- Slow retrieval of data from SQL databases: Since we had a lot of data and complicated queries, we experienced problems swiftly transferring data from our SQL database into Power BI. In order to obtain data more quickly, we attempted to use AAS cubes. Our issues with data retrieval were resolved and processes were considerably faster when we linked Power BI straight to these cubes rather than via SQL.
- Data modelling: We have implemented strong data modelling techniques within Power BI which involves structuring and organizing the data in a way that ensures optimal analysis and visualization capabilities within the reports and dashboards.
- Automated process replaced manual flow: Using automated processes instead of manual ones has simplified things. Making this adjustment decreases errors and saves time. All things considered, it increases our productivity and aids in producing superior outcomes.
- Dax optimized: Increased the effectiveness of our Data Analysis Expressions (DAX) to expedite the processing of data.
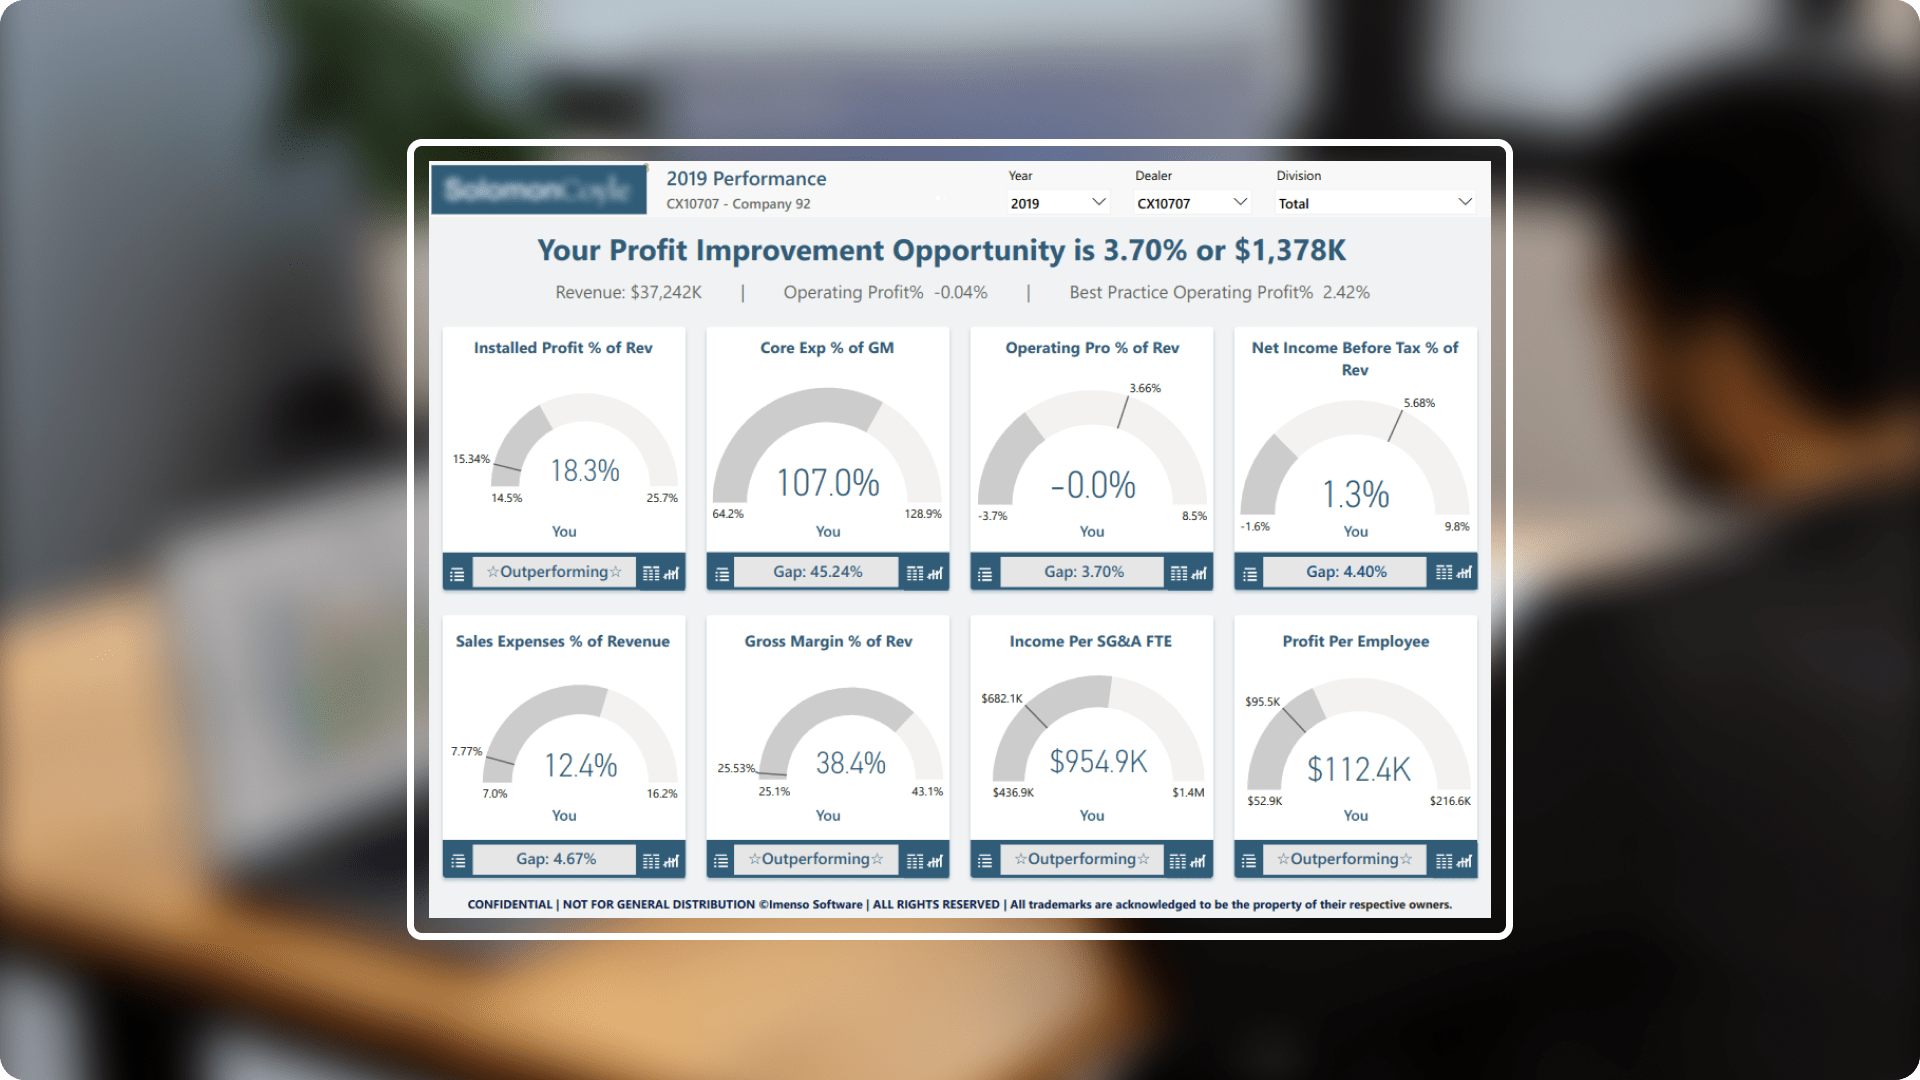
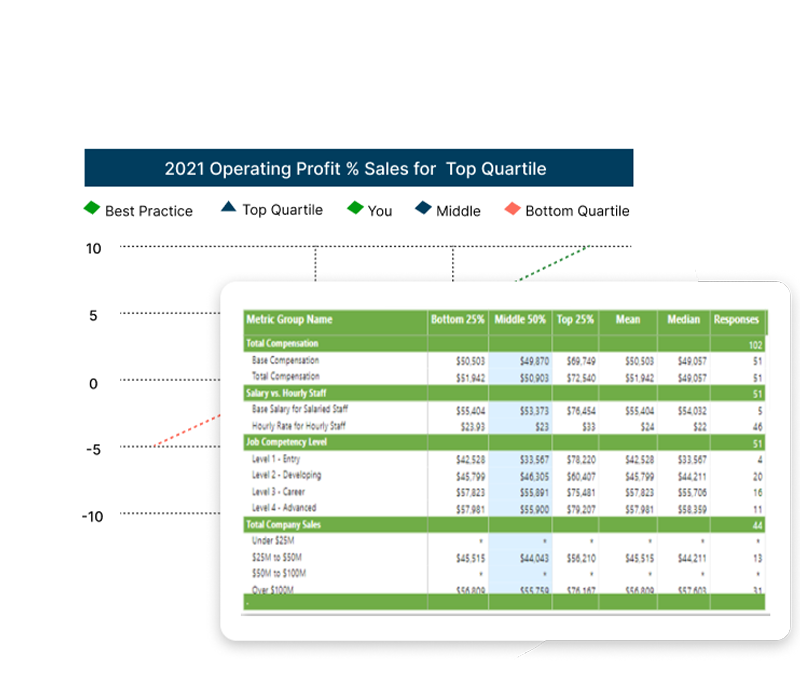
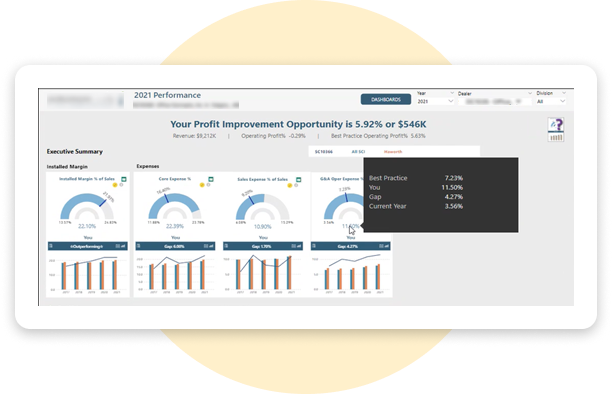
SolutionAn AAS cube served as the basis for a Power BI report that we generated. It is our primary tool for making informed decisions, and this report provides us with an in-depth analysis of our business performance. Data allows us to evaluate our performance, make wiser decisions, and maintain our competitive edge. We can examine key metrics in detail and compare them to industry norms using the Metric Explorer tab, which aids in our ongoing progress. All things considered, these tools support us in making strategic decisions and gradually enhancing our output.
-
 Data management made simple with AAS structure : Our AAS structure centralized all of our data, which greatly simplified corporate management.
 -
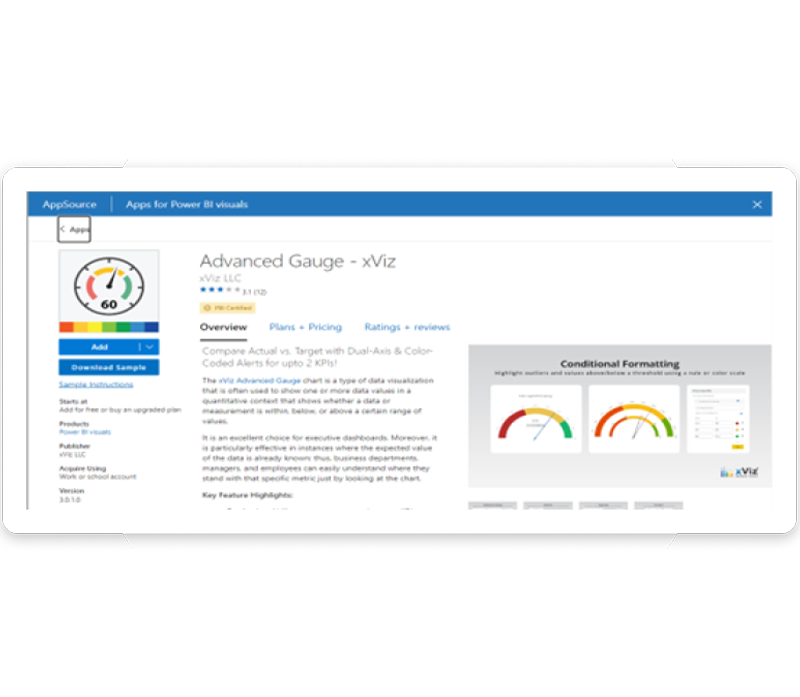
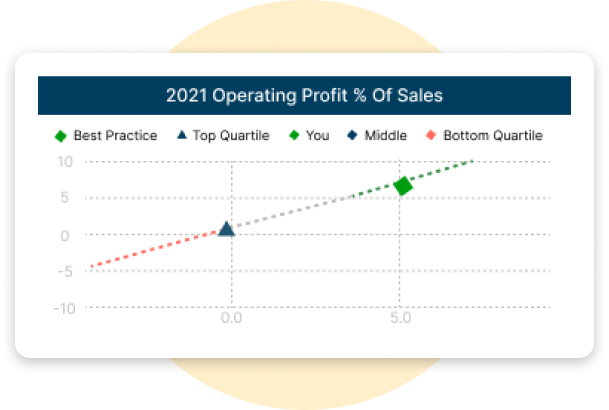
 Improved visuals with personalized advanced gauges : Improved the visual appeal and informational content of our gauge chart by adding labels, colours, and target values.
 -
 Embed reports: With Power BI Embedded, businesses can simply integrate eye-catching data charts and graphs into their websites or applications. Customers may view and interact with the data from within the app, saving them time and effort.
Integration.
Equipped with a variety of
data source.
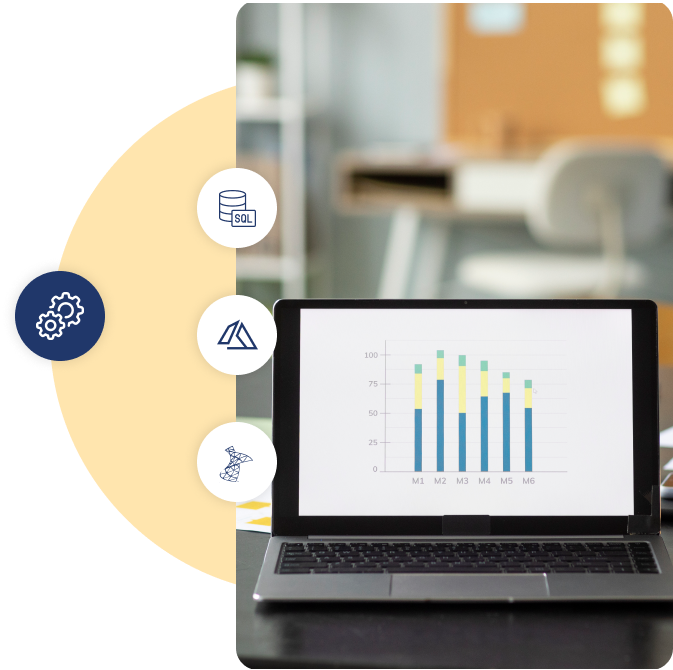
Expanded the possibilities of our report by utilizing the range of Power BI integration options. These integrations enhance functionality and compatibility by enabling us to easily interact with other tools and applications like -
- SQL Server
- Azure Services (Azure SQL Database, Azure
Analysis Services) - SSRS
- AAS cubes
Customization.
How we played with charts?
Customized charts for improved data representation
In order to effectively display the data, we did more than just add charts; alternatively, they gave each one a unique design that serves its intended function.
Improve data visibility
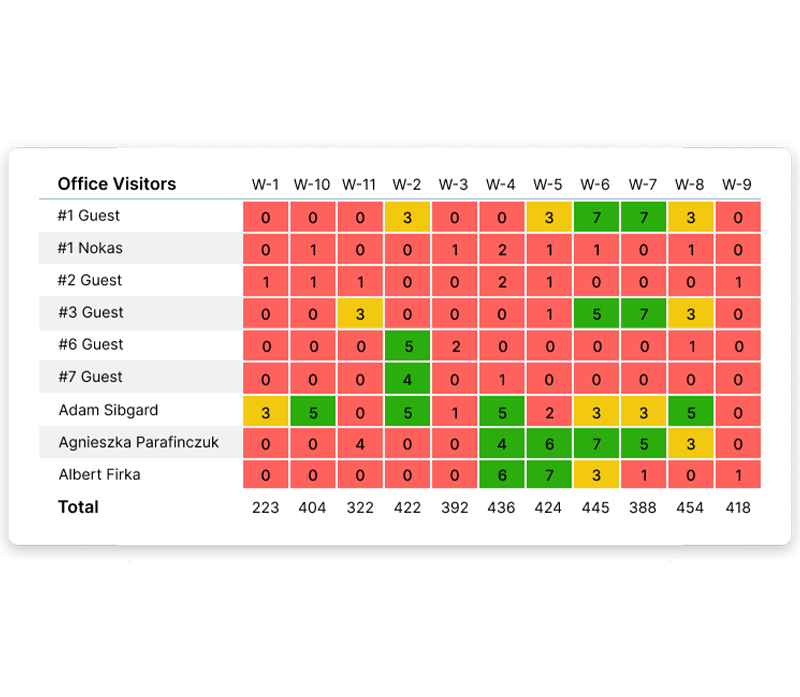
The presentation of the data is dynamically adjusted based on predefined criteria through the use of conditional formatting, which facilitates the quick identification of patterns, trends, and irregularities.
Customized data display
Included unique graphics with xViz Advanced Gauges, which are intended to improve data representation and offer specific insights for better decision-making.
Enhancement.
By adding useful features.
Incorporated additional features to improve functionality and provide a smoother user experience.
Interactive buttons and helpful tooltips
Incorporated interactive buttons so that viewers could choose and act on our visuals. Tooltips have also been included to offer viewers with further context and help them understand how the buttons function.
Dynamic tooltips
Users hover over data points or graphic components in our reports, dynamic tooltips emerge. These tooltips offer insightful background information in the form of relevant data, industry trends.
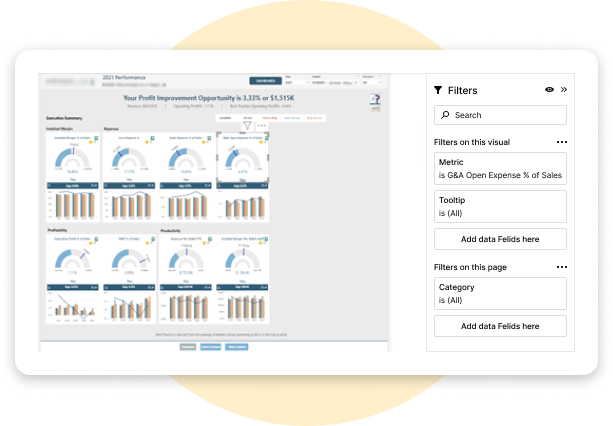
Page and report level filters
Users can customize their viewing experience by applying certain requirements to pages and graphics by using both Page and Report Level Filters.
Enhancing interactivity with edited interactions
By adding the ability to Edit Interactions, we enhance user involvement in our report and provide a more tailored and intuitive viewing experience.
Explore more.
Additional features.
Integrated Single Sign-On.With the simplicity of an integrated Single Sign-On (SSO) system, we've put in place a single login system that enables users to access numerous applications with only one set of credentials.
Row Level Security.We implemented Row Level Security (RLS), which filters data based on defined parameters to enhance security measures.
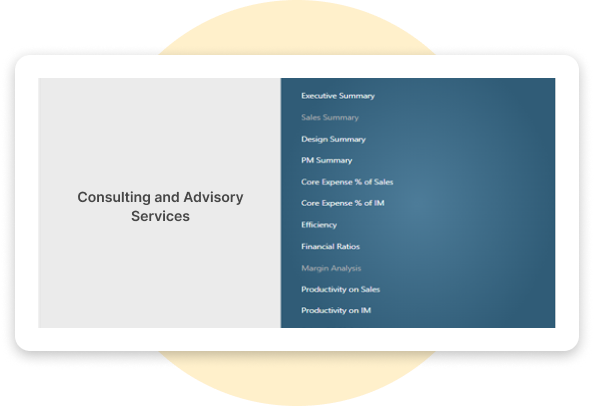
Scheduled Data Refresh. This report's Consulting and Advisory Services information is updated on a regular basis through scheduled data refreshes, guaranteeing its accuracy and relevance. The data in this report is refreshed on a regular basis to guarantee that the information is updated.
Looking to build similar
solution for your business?
We have all the required expertise to help your business grow
I would like to..


