Business intelligence dashboard for legal industry.
- Industry: Legal
- Country: Turkey
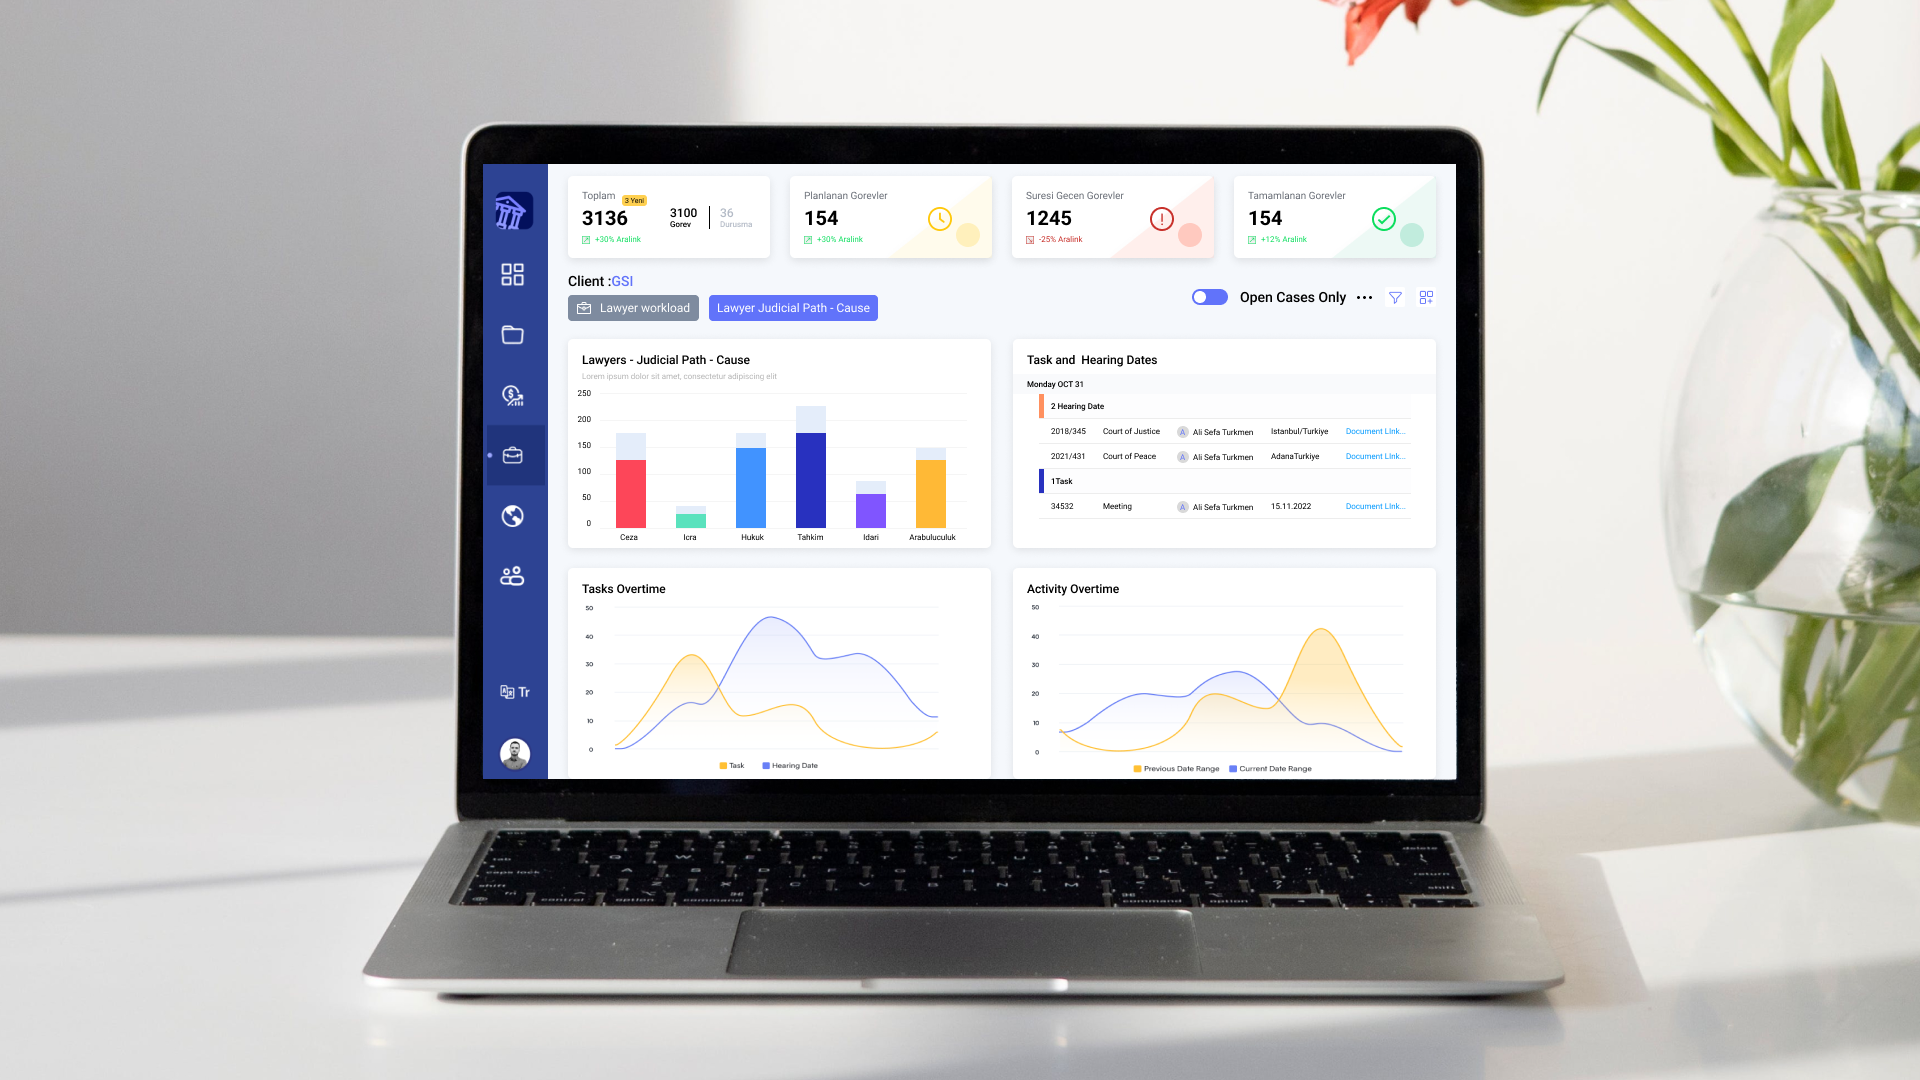
The goal of developing a business intelligence dashboard for the legal industry is to empower legal professionals with actionable insights, foster efficient decision-making, and enhance the overall effectiveness of legal practices through the strategic use of data visualization and analytics.
The core challenges
- Dynamic layout creation: Empower users to tailor their own layout according to their specific needs and preferences.
- Min-Max value algorithm: Adjust the default behavior of charts to effectively accommodate small values in relation to significantly larger ones.
- Nested filters: Establish a hierarchical or layered structure for refining data, enable users to save filters for future use and prevent applied filters from being reset on page load.
- Data transform algorithm: Organize extensive raw data into a format tailored to meet the specific requirements of the chart.
- Export reports: Generate a dynamic report based on selected charts, KPIs and specified filtered records.
SolutionWe have developed advanced data visualization tool that to represent complex legal data in an easily understandable format. This tool equipped with a diverse array of charts, enabling the graphical and visual representation of data for enhanced clarity and interpretation.
-
 Centralized data management: Context API is utilized to store data for access globally in application.
 -
 Presentation: Customize your layout by incorporating a variety of charts and KPIs on individual pages.
 -
 Drag and drop charts: Organize and automatically preserve your layout by rearranging charts using the drag-and-drop feature.
 -
 Multi language: Users can select their preferred language from the available options, ensuring a more personalized and user-friendly experience.
 -
 Drill down: Explore supplementary charts related to a specific main chart by utilizing the expand option.
Integration.
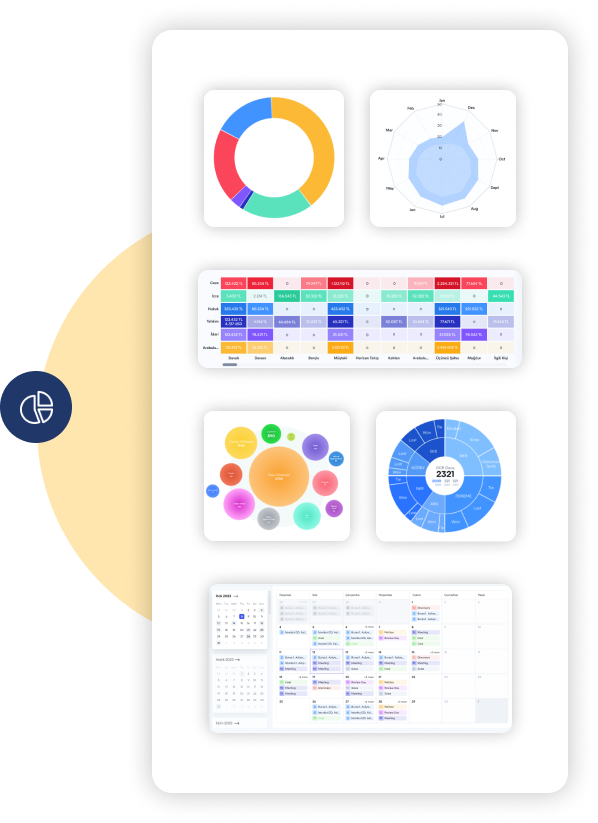
Equipped with a variety of chart types.
The application offers a diverse and comprehensive range of visual representation options for data. We have integrated different types of Fusion charts and amCharts.
FusionCharts.
- Heat Map chart
- Time series chart
- Bubble chart
- Stacked bar 2D chart
- Treemap chart
- Maps chart
- Sunburst chart
- Radar chart
- Pie 2D chart
- Doughnut 2D chart
- Column 2D chart
- Bar 2D chart
amCharts.
- Treemap chart
- Bubble chart
Optimized for fast loading
Customization.
How we played with charts?
We haven't just integrated the charts; we've tailored them to enhance data visualization, ensuring a more precise representation that perfectly aligns with each chart's unique characteristics.
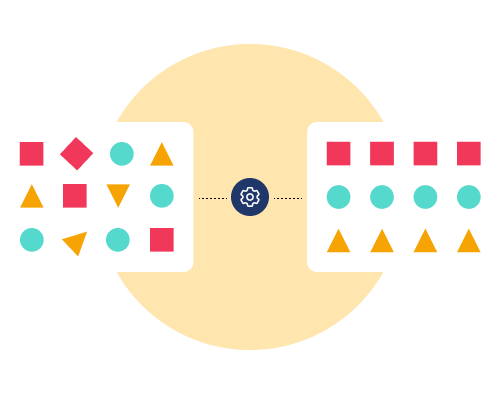
Data transform algorithm
Developed an algorithm for transforming raw data to align with the specific requirements of the chart and optimize the information for effective visualization, ensuring that the chart accurately and meaningfully represents the underlying data.
Color palette algorithm
The algorithm for dynamically adapting a color palette involves the utilization of a set of rules and procedures that automatically adjust the colors used in a chart based on changes in the values of the underlying data.
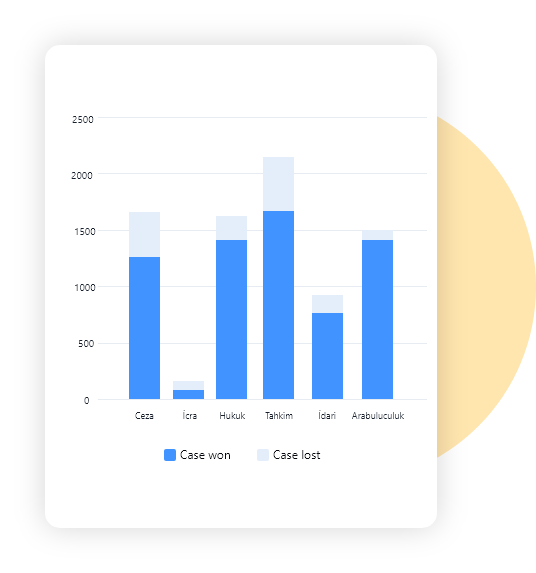
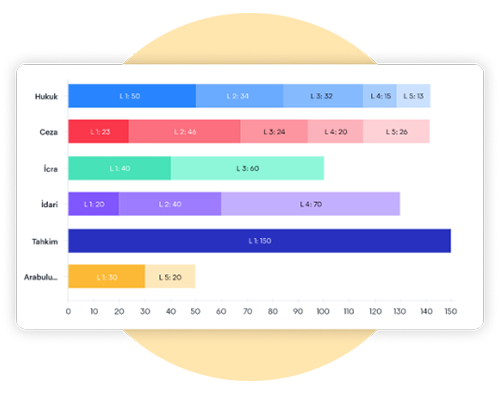
Min-Max algorithm
When there is a substantial difference in magnitudes, the smallest value bar may not be visible. To address this, we have implemented a min-max algorithm to ensure the proper representation of all bars in the chart.
Enhancement.
By adding useful features.
To elevate the application and provide an enhanced user experience, we've incorporated a range of features empowering users to interact seamlessly with charts and data.
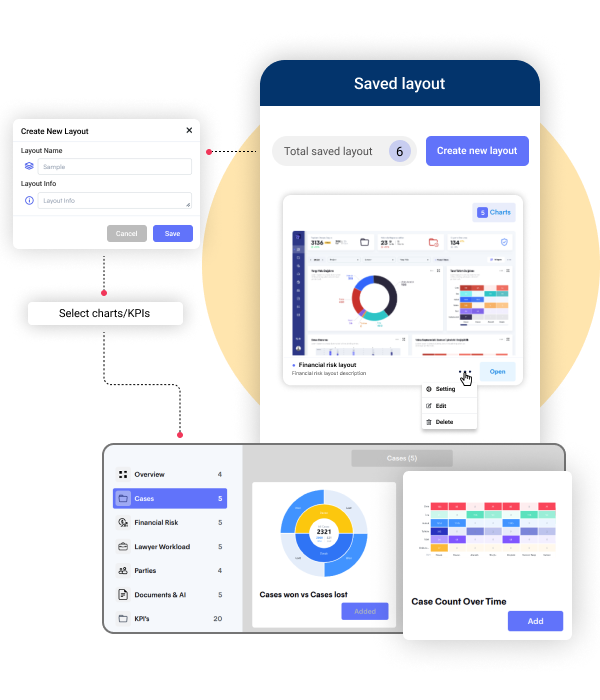
Create and save layout
Users have the flexibility to craft and save personalized layouts by incorporating their preferred charts and KPIs, facilitating quick access to them from a centralized location.
The system empowers users to create multiple layouts based on their convenience and specific needs.
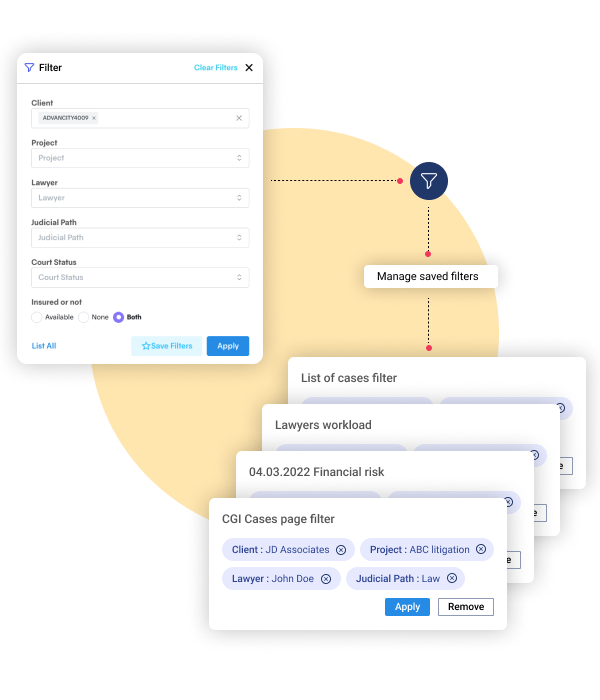
Nested filters
Implemented advanced filters to apply multiple levels of filtering, with each layer refining the dataset based on specific conditions, and prevented the applied filters from resetting on page load.
Moreover users have the ability to customize and save their filter configurations for future use.
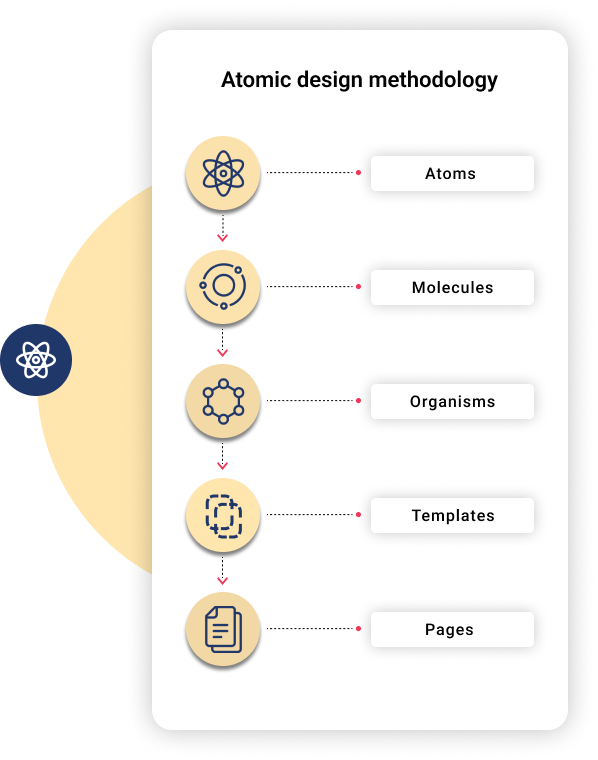
Atomic design
To establish a well-organized framework for constructing user interfaces, we adhered to the principles of the atomic design methodology.
This approach fosters a modular and systematic method in UI development, emphasizing the importance of reusability and maintainability.
Export preferred charts/KPIs.
Through the export option, users can effortlessly refine their data and download it. The resulting PDF is enriched with embedded metadata, including the export date and details about the selected or applied filters.
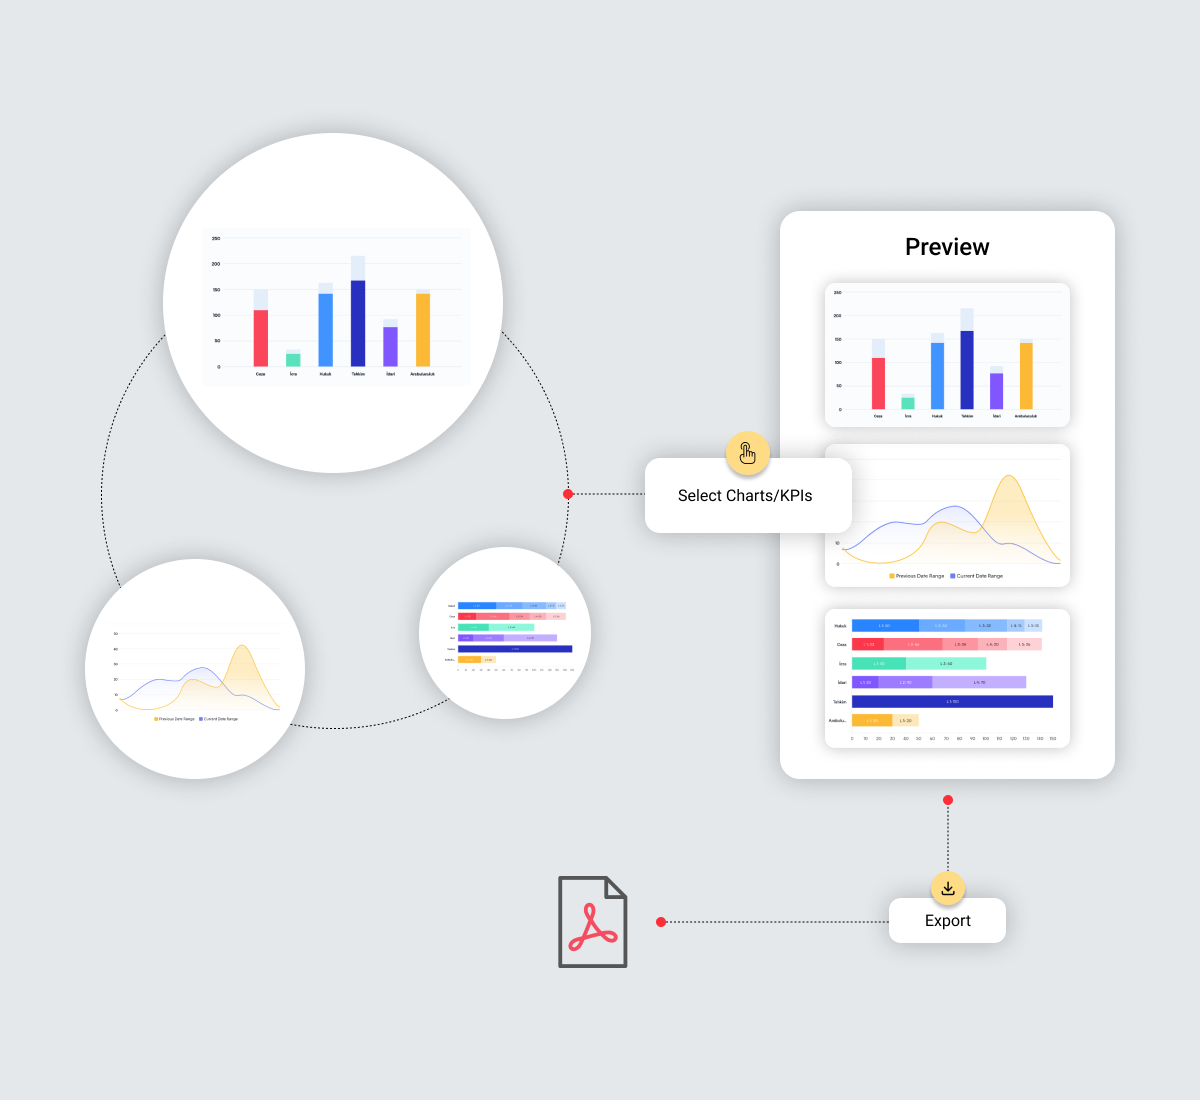
Select charts/KPIs
Developed a user-friendly option that empowers users to seamlessly select the charts and KPIs of their choice for export.
Preview selection
Before proceeding to the next step of the export process, the system enables users to preview their selections.
Export to PDF
After ensuring all selections are accurate, simply press the export button to obtain your customized PDF.
Explore more.
Additional features.

Activity log. The Activity log option serves as a meticulous recorder, systematically capturing and presenting a chronological history of user interactions and changes within the application.

Breadcrumbs. We've developed custom breadcrumbs that facilitate effortless switching between chart tabs, all while preventing any unnecessary page reloads for a smoother user experience.

Single Sign-On (SSO). Implemented an integrated Single Sign-On authentication mechanism, empowering users to seamlessly access a multiple applications with a unified set of credentials.

Key Performance Indicators (KPIs). We have seamlessly integrated a diverse set of KPIs to systematically evaluate and optimize the effectiveness, efficiency, and overall performance of legal practices.


