[Updated] Top 9 Best Power BI Dashboard Examples

Microsoft power BI is an excellent data analytics and visualization tool with many uses. But creating corporate dashboards for any business or company is among the best ones.
As it happens with everything in technology, dashboard creation keeps evolving in power BI. So in this blog, we present the top examples of dashboards for analytics, sales, app management, and more.
Power BI has numerous possibilities of creating dashboards, and as an experienced Power BI development company we have used it to develop data solutions for businesses worldwide.
Power BI dashboards for businesses
Corporate machines have data coming from everywhere on the internet – websites, apps, social media, and others. And tools like power BI have been the data declutters for companies with Big data.
Power BI dashboards have many purposes in organizations, the primary being monitoring and assessing business performance. Dashboards are the robust tech tool that helps managers and executives to glide through data and make sound business profiting decisions rather than relying on instincts.
Dashboards are also helpful in presenting the work of data analytics in a visually appealing format to understand KPIs and other important information for making efficient decisions.
Power BI is a star of all data visualization tools as it provides a ton of dashboard creation and customization options for companies to meet their goals.
A business has many aspects, different departments, and projects needing constant inspection. Also, in the rapidly changing technological landscape, dashboard’ features must be aligned with business needs, market, and customers’ demands.
Our team of Power BI experts understand the importance of business intelligence and data analytics in modern markets. That is why we have listed down the ten best Power BI dashboards.
We breakdown of the different metrics dashboards represent features and how they can be helpful to drive key insights. Don’t miss them!
Top 9 Power BI dashboard examples

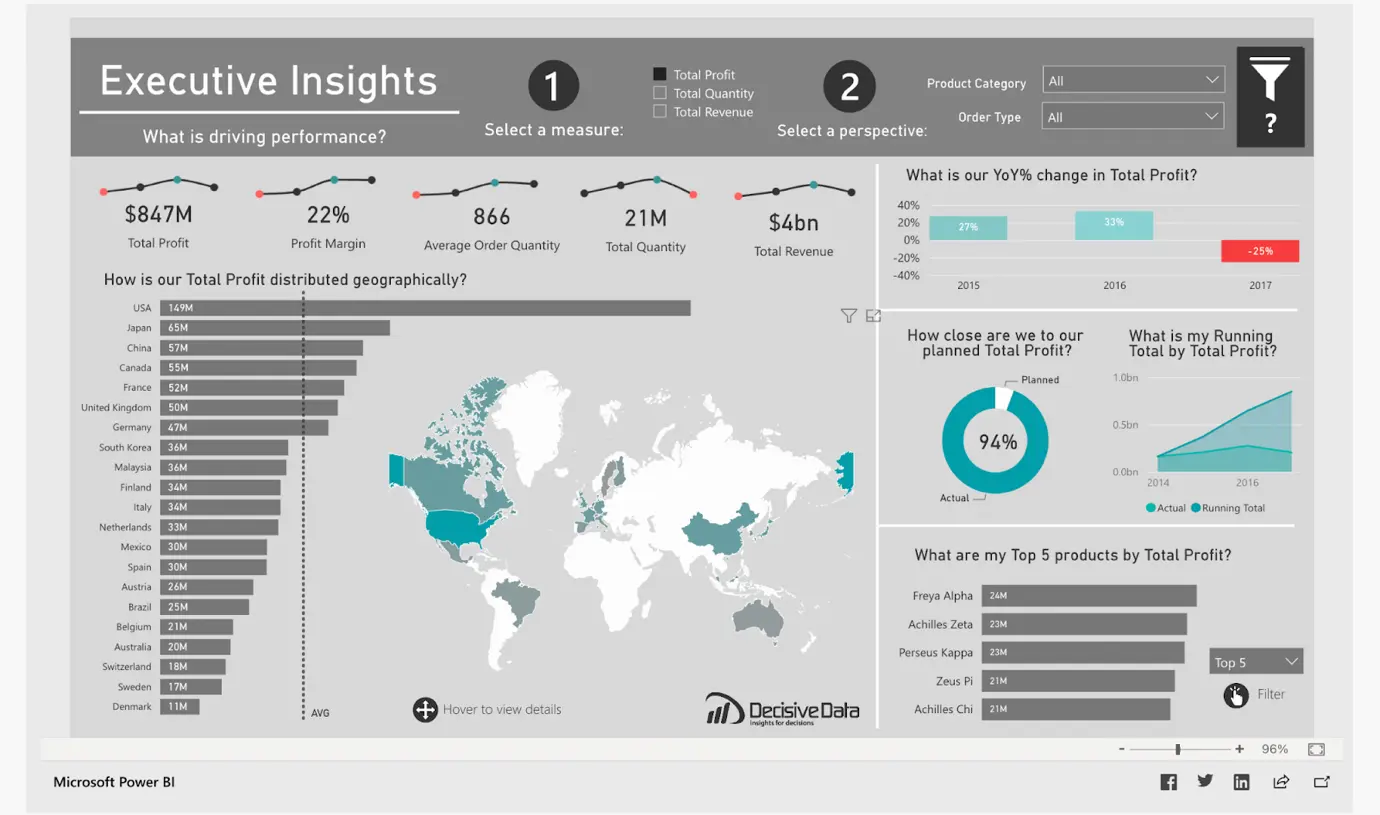
1. Executive insights by decisive data
Source: Microsoft Community
The executive insights dashboard gives a clear picture of the critical data about products, profits, and location. Executives can quickly make decisions during a meeting about
- Profit margins
- Supplies
- New Product launches, production
What this dashboard shows
- The top 5 products and their global sales
- Revenue generated in different countries
- How much profit goal has been achieved
- YoY% changes every year
What this dashboard offers
This dashboard is designed for global-minded companies to quickly answer “how are they performing.” Using dynamic visuals, this dashboard pushes for a user-flexible and interactive data session with a focus on multiple angles of business – total profit, total quantity, and total revenue. Each one of these particulars has a similar interface to provide ease of user familiarity.
Total quantity
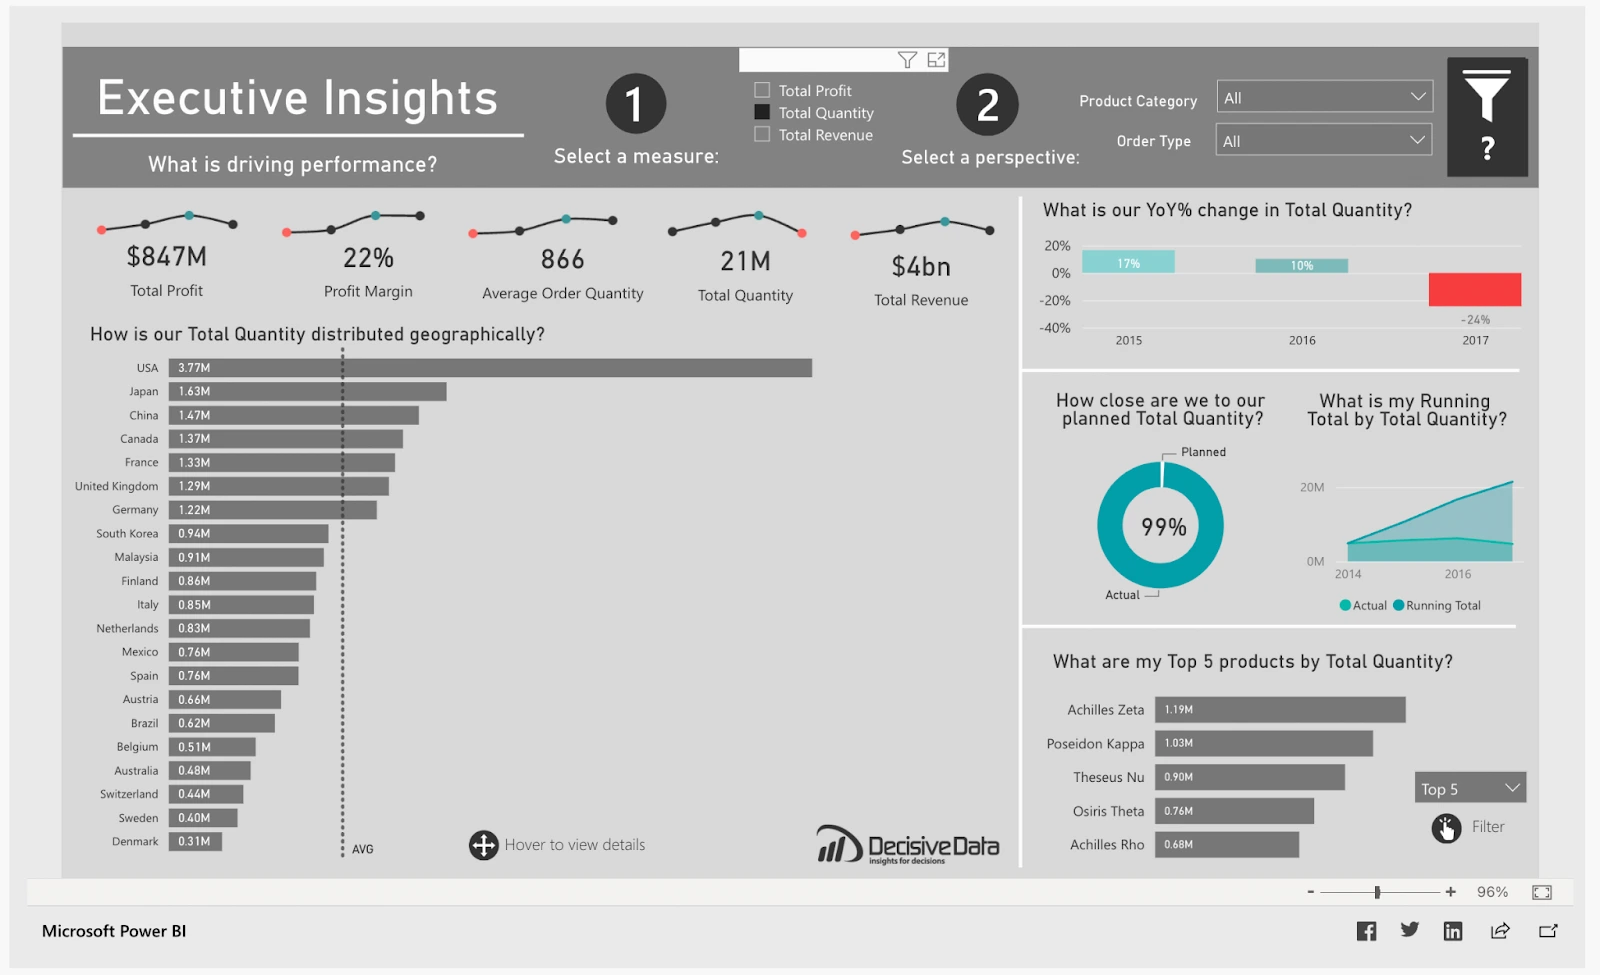
Source: Microsoft Community
Total revenue
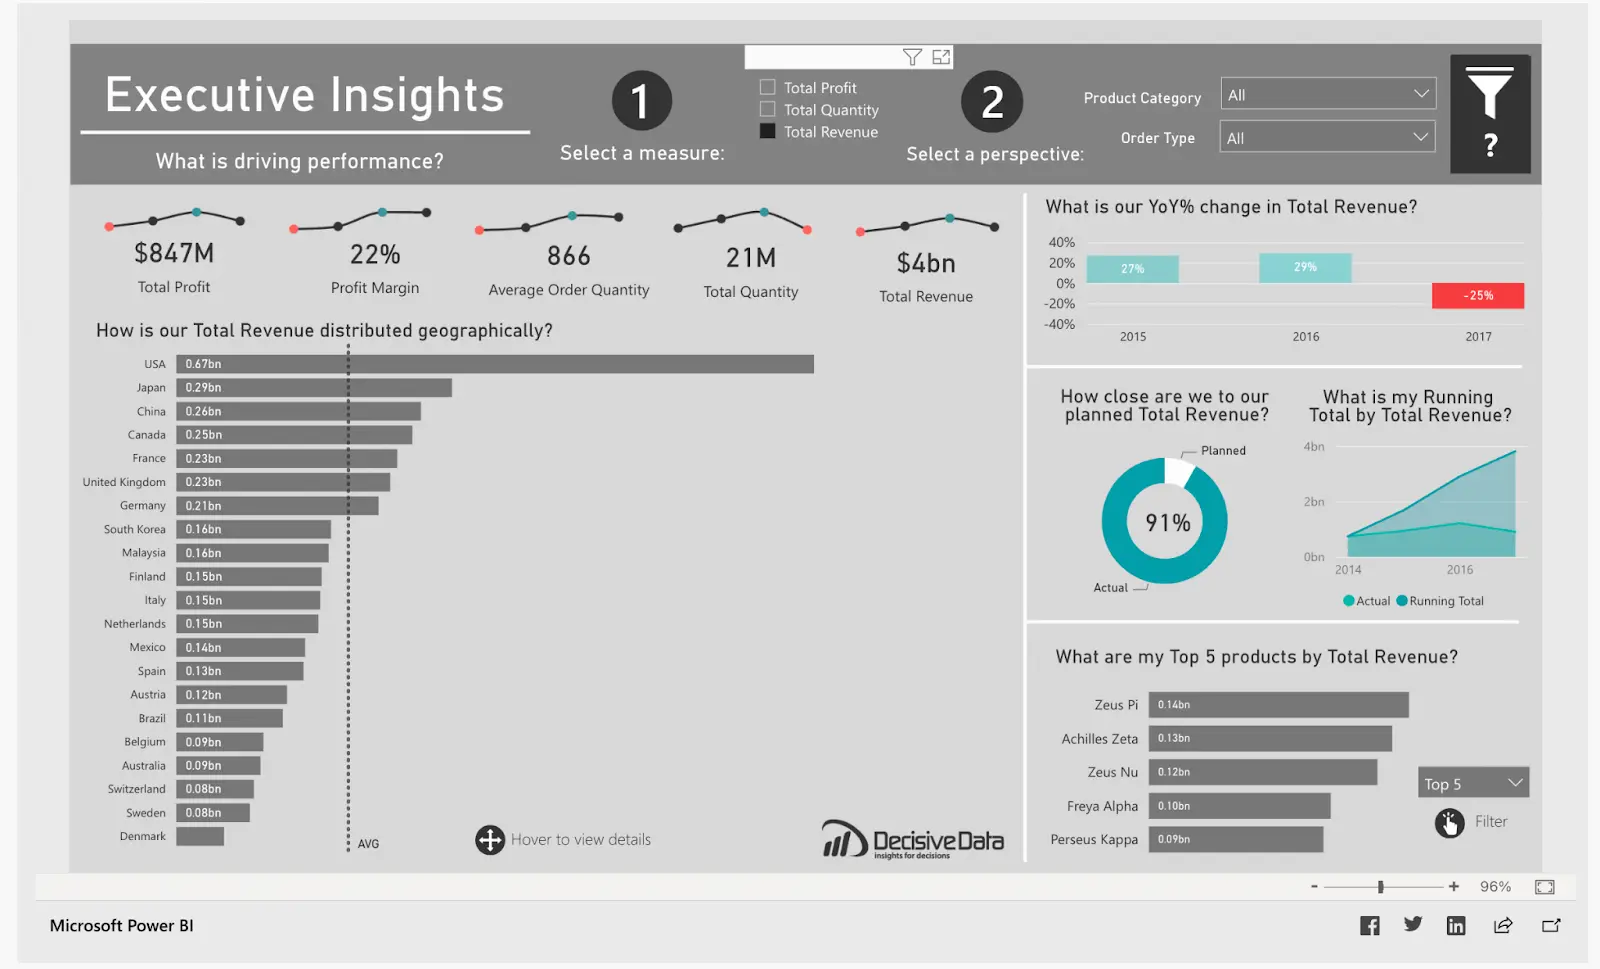
Source: Microsoft Community
One look at the dashboard tells all the important attributes of the company:
- What product are they selling?
- Which country are they selling it in?
- Which year are they selling it?
- How are they selling
What people love about this dashboard
This dashboard is a prime example of user interactivity, attractive mapping, and dynamic visuals. It gives users various statistics in one frame saving valuable real estate.
Also Read: How To Find The Most Reliable Remote Microsoft Power BI Consultants and Companies for Hiring?
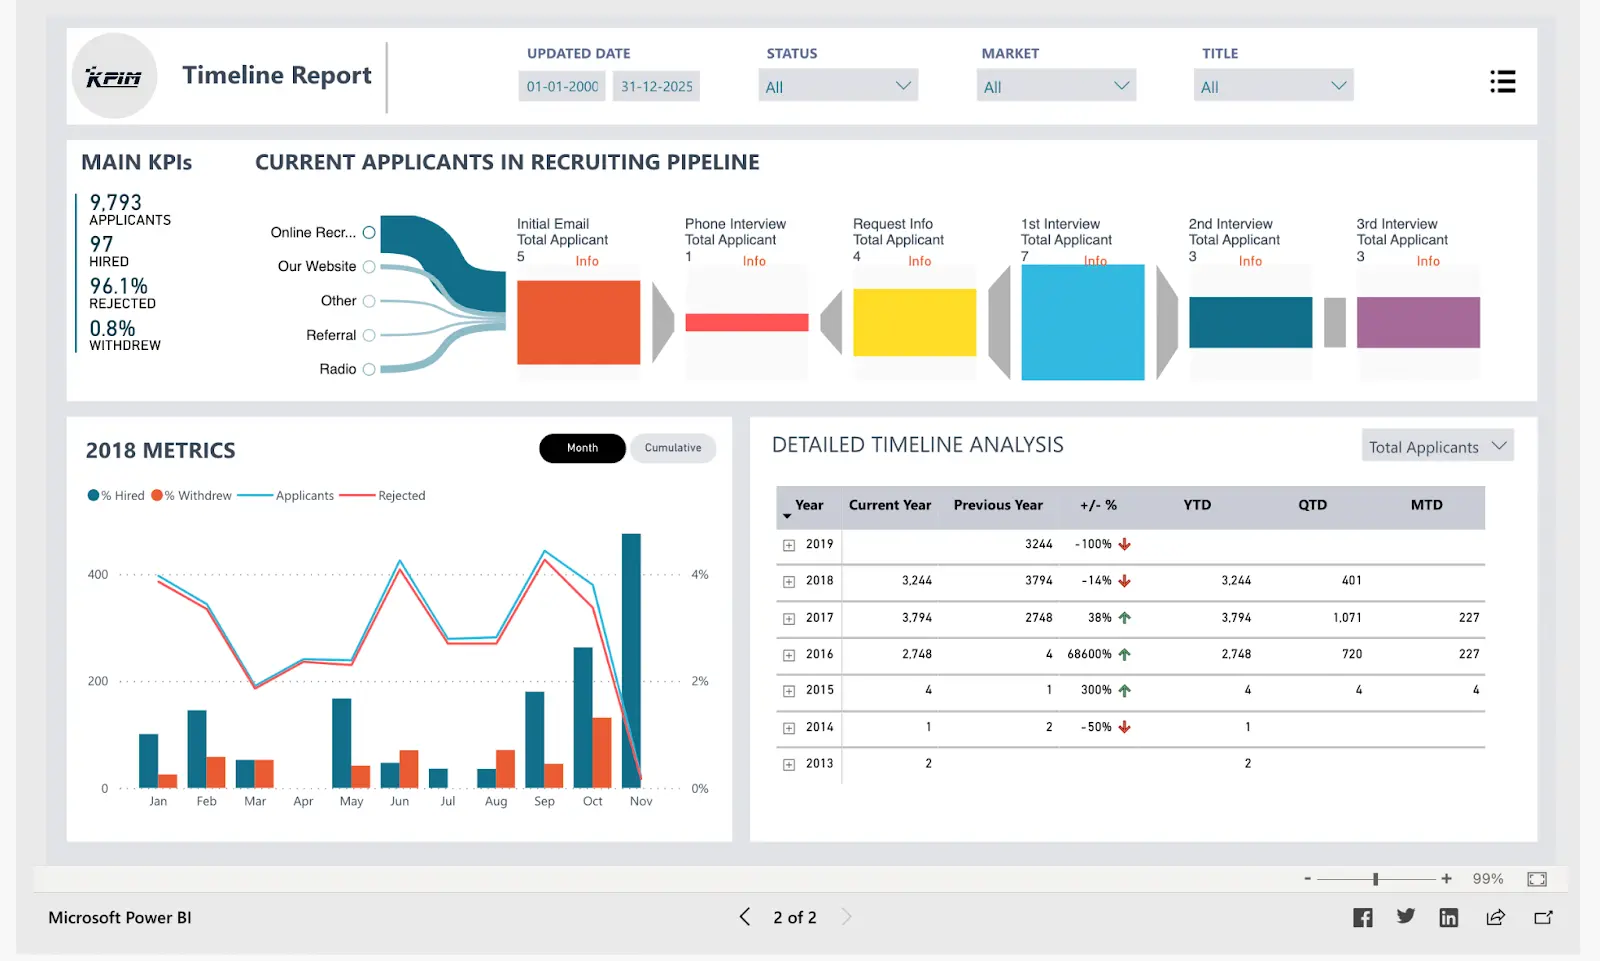
2. Recruiting pipeline report
The recruiting pipeline report is an excellent tool for the HR department of a business.
It provides deep insight into the recruiting process with four main KPIs –
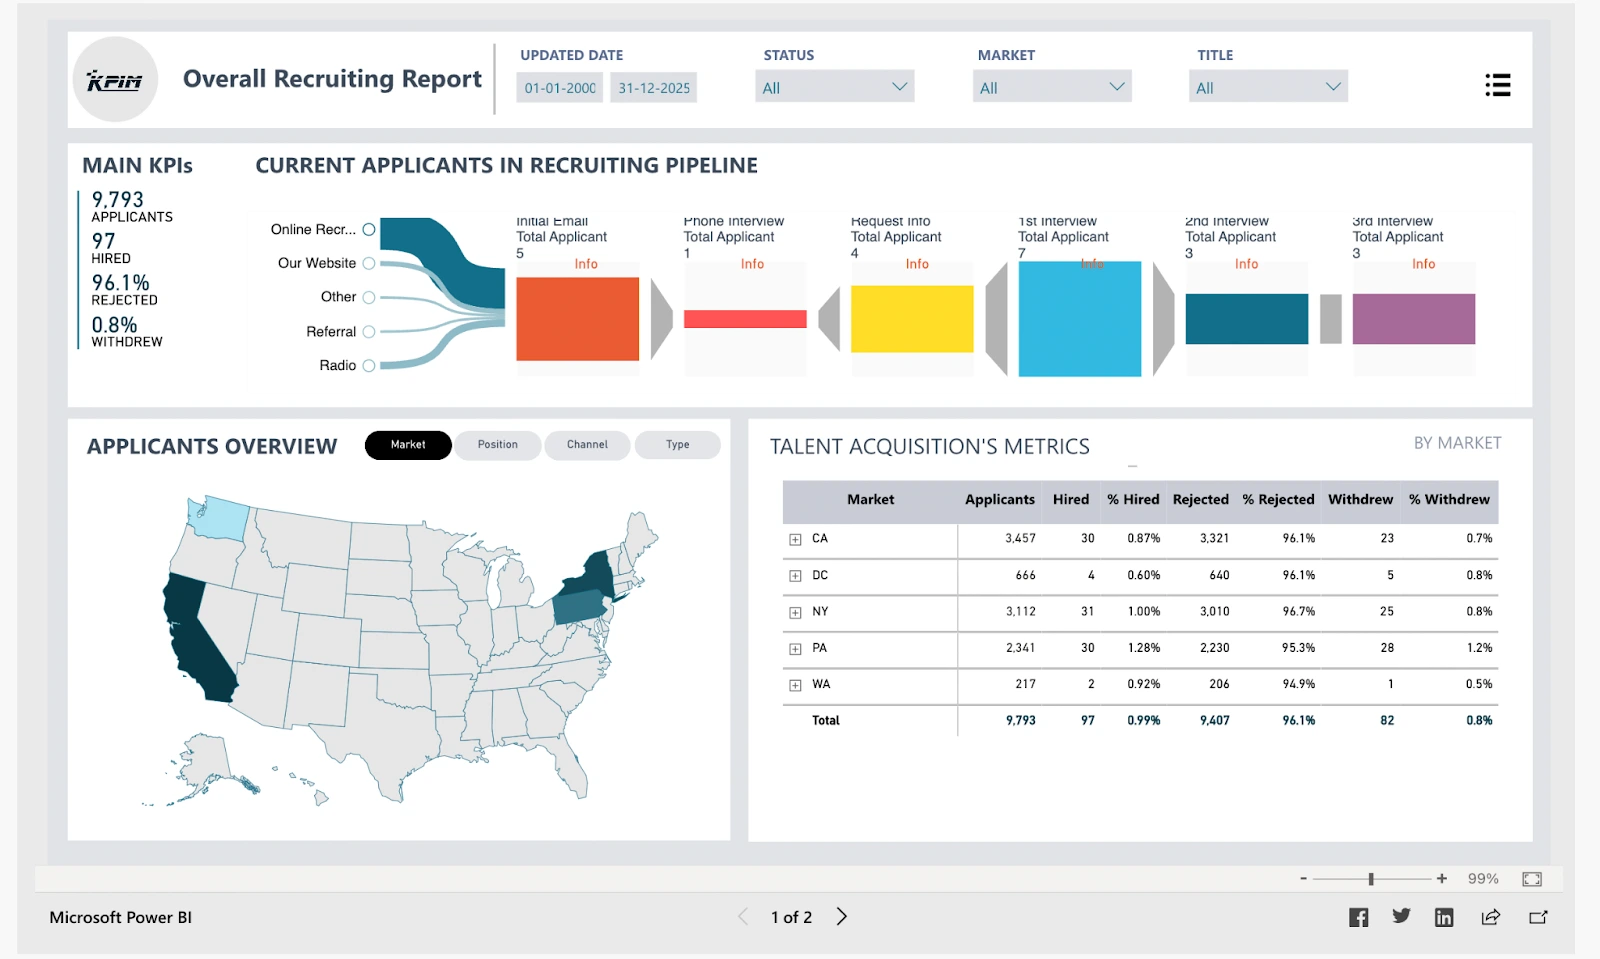
Source: Microsoft Community
- Total applicants
- Total hired
- Total rejected
- Withdrawal during the process
On the top of the dashboard, the pipeline visualization of every stage of the recruiting process along with the number of candidates in each makes it a piece of cake to evaluate for the hiring team. The sources of application are mentioned with the percentage of applicants through them.
Source: Microsoft Community
The next page of this dashboard has a detailed timeline analysis of recruitment statistics of the past years and a graph showing the recruitment metrics of every month in a single year.
What the dashboard offers
This dashboard is a simple visualization of all the possible data related to the recruitment process. The key insights the dashboard provides
- Summary of applicants in different phases of the pipeline
- Recruiting results of applicants using filters like location, sources, title, etc
- Monthly trend of total hired and rejected applicants
- Yearly hiring and rejection numbers

What people love about this dashboard
The applications of this recruitment pipeline dashboard go beyond analyzing the number of applicants. It can help HR managers to
- Monitor the recruiting process as a whole
- Analyze hiring trends over the years and in a single year
- The effectiveness of the hiring process
- Hiring based on title, sex ratio, amount of experience
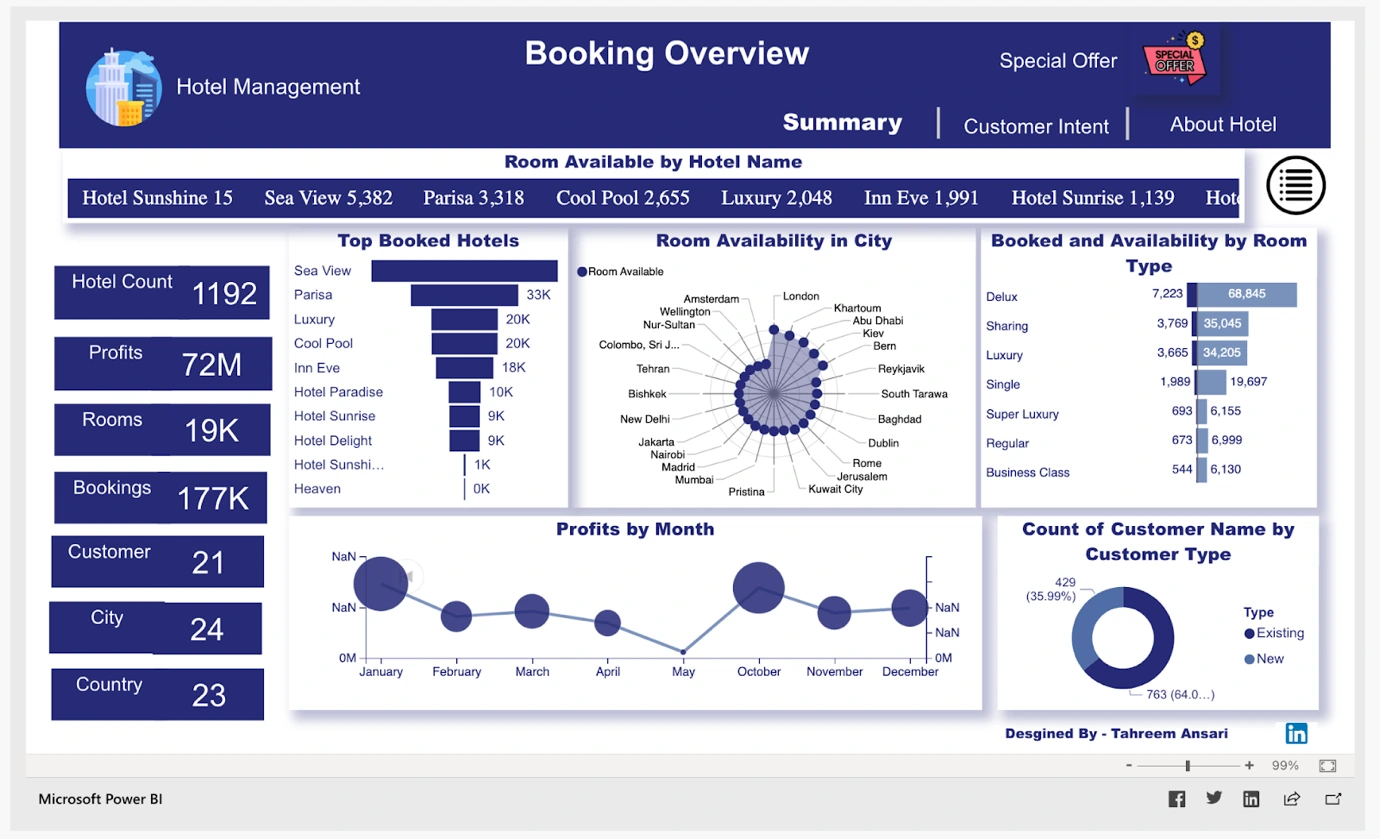
3. Hotel management dashboard
Source: Microsoft Community
It’s a beautiful looking dashboard with 12 stats on a single screen. The hotel management dashboard can help hospitality staff to see –
- Top booked hotels
- Room availability in different cities
- Room availability and booking of different types
- Total hotels
- Profits
- Total no. of rooms
- Bookings
- Profits sorted by month.
- Customer type
The dashboard has clean visuals that offer hotel staff the liberty to evaluate all attributes of hotels and guests. It empowers users with interactivity and investigates data on their own terms.
Source: Microsoft Community
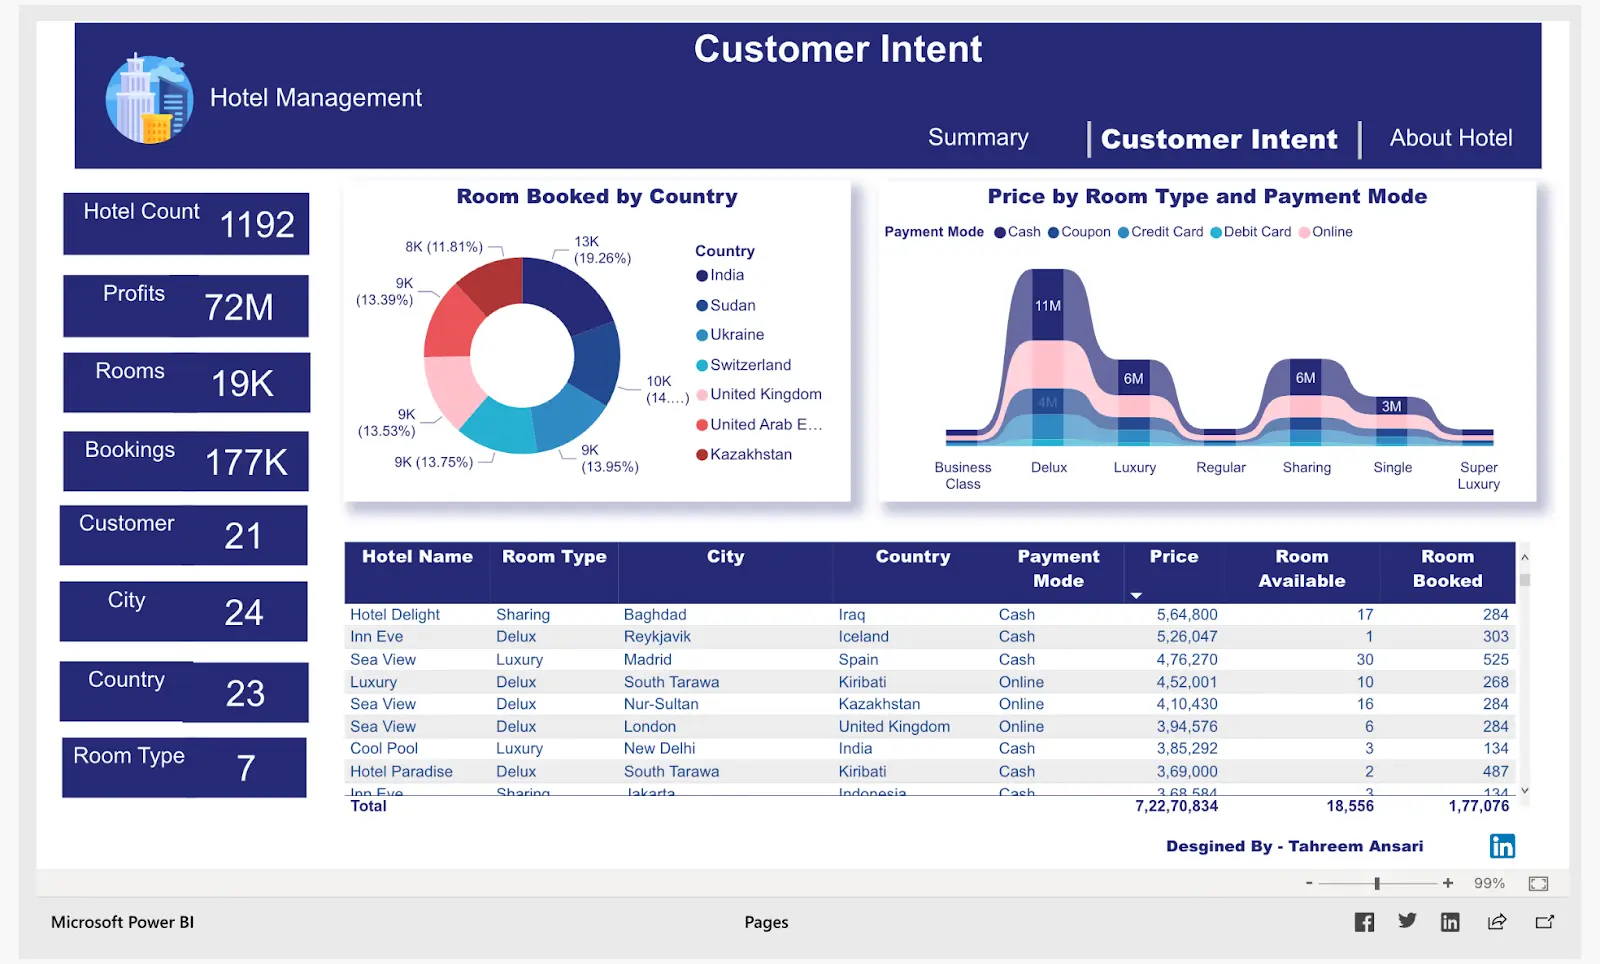
The customer intent page has a circular chart showing the percentage of rooms booked in different countries. It also has a table with customer bookings, hotel names, room types, rooms booked, and more.
What the dashboard offers
A hotel management dashboard is meant to help hotel managers and staff to operate through data-driven decisions. Instead of looking over a dozen pie charts, graphs, and tables, one dashboard for all statistics is far more efficient. It has
- Percentage of rooms booked by countries
- Price of room and payment mode
- Total no. of hotels, rooms, bookings
- Most booked hotels with prices
- Type of room available
- Profits by month
What people love about this dashboard
To get a complete overview of the hotel metrics on one single screen, this dashboard is perfect. It helps owners to visualize the main KPIs of bookings, rooms, and hotel performance over time. It can assist stakeholders and staff to
- Keep an eye on occupancy.
- Improve day-to-day operations
- Check targets
- Segment data for business reports
- Filter and drill into information with one dashboard
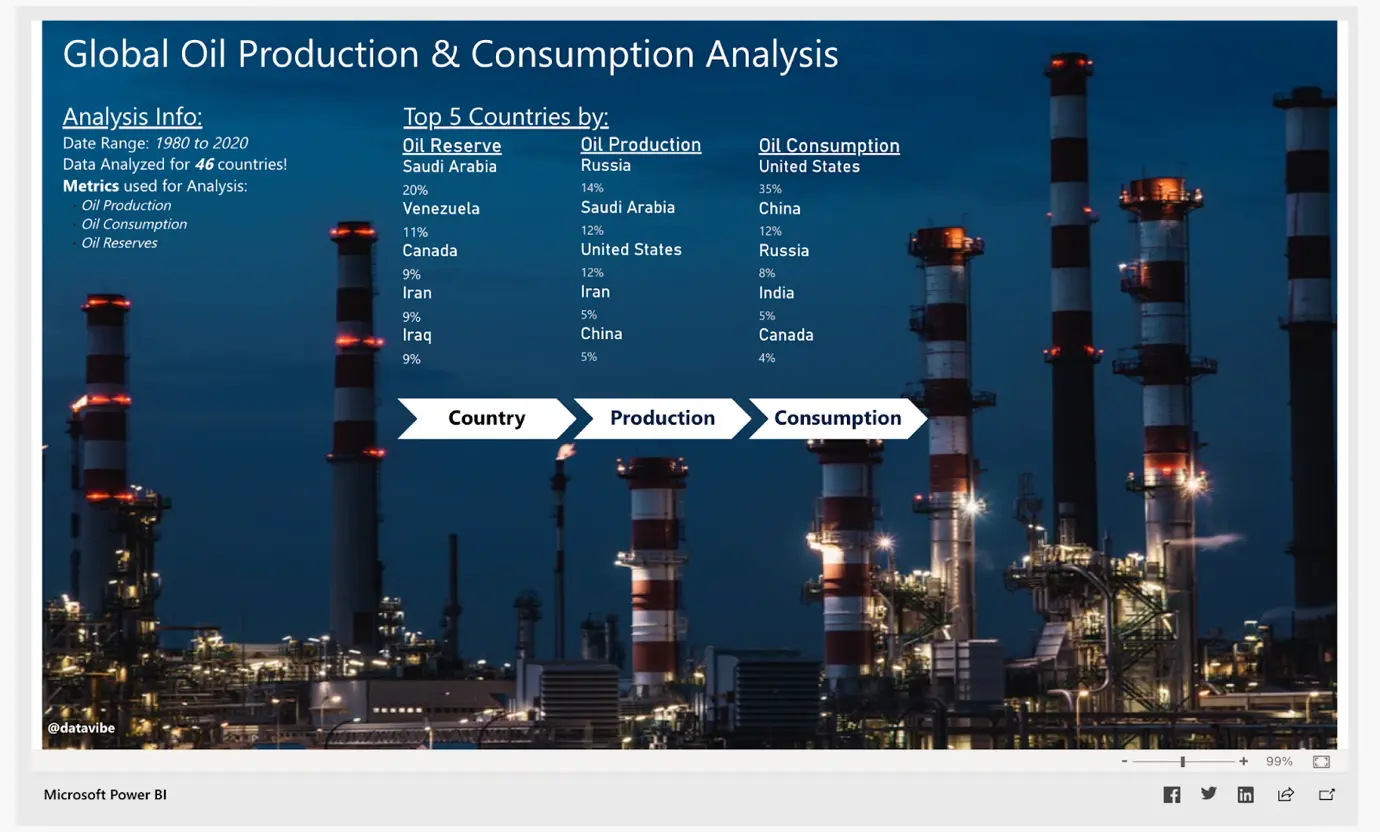
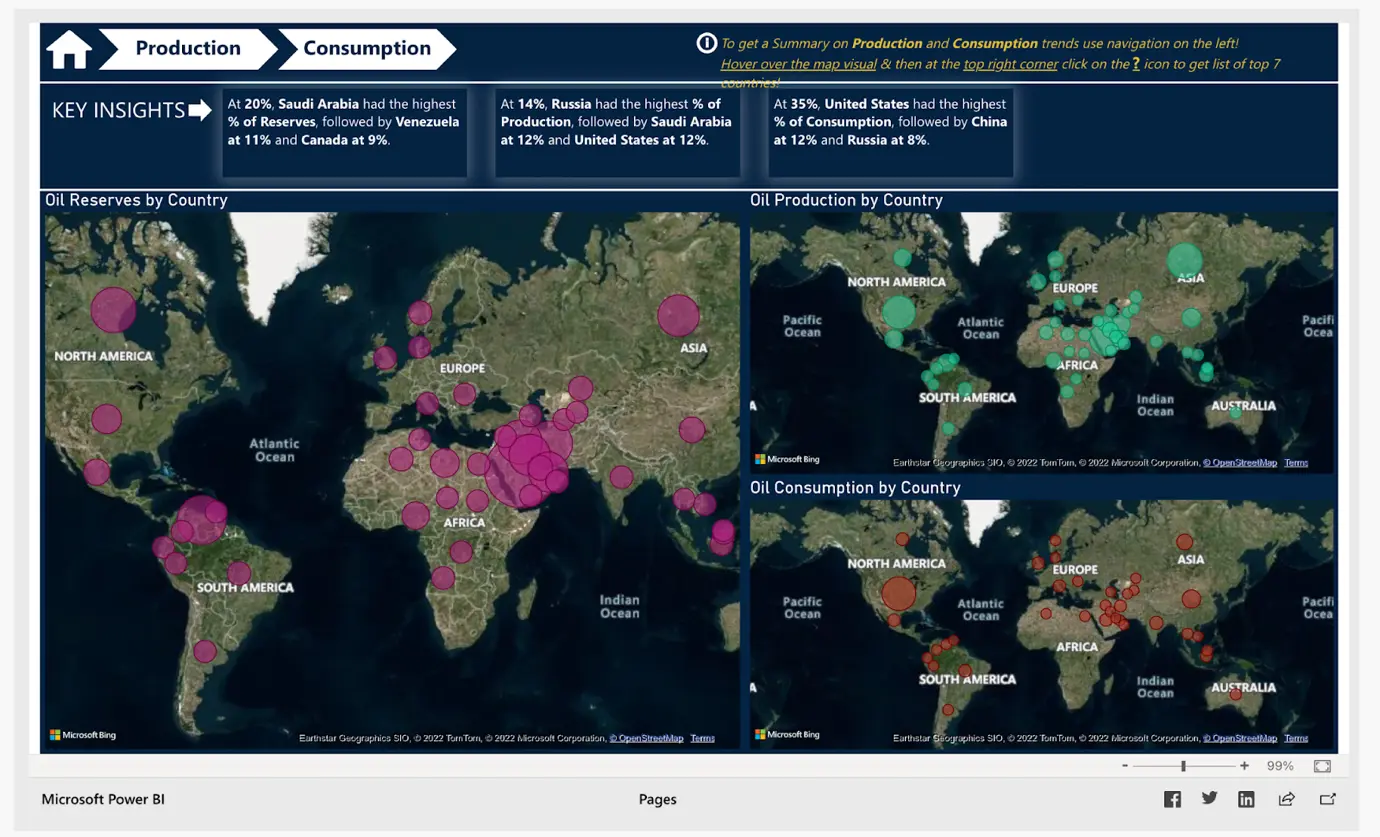
4. Global oil production and consumption
Source: Microsoft Community
This Power BI dashboard gathers the key metrics of oil production and consumption globally to make it easy for employees to analyze vast amounts of data in real time. The dashboard here shows the top 5 countries with the most oil
- Reserve
- Production
- Consumption
Oil and gas industry faces the challenge of Big data visualization to track critical parameters, production numbers, costs, etc. Power BI dashboards offer a refreshing visual solution for the entire industry worldwide.
Source: Microsoft Community
The country tab of this dashboard reveals the key insights about the top 3 oil metrics – reserve, production, and consumption of all countries. It can help employees to make data-backed decisions with critical information and also
- Track production of oil in different countries
- Total production in the last few months
- Oil consumption by countries
Source: Microsoft Community
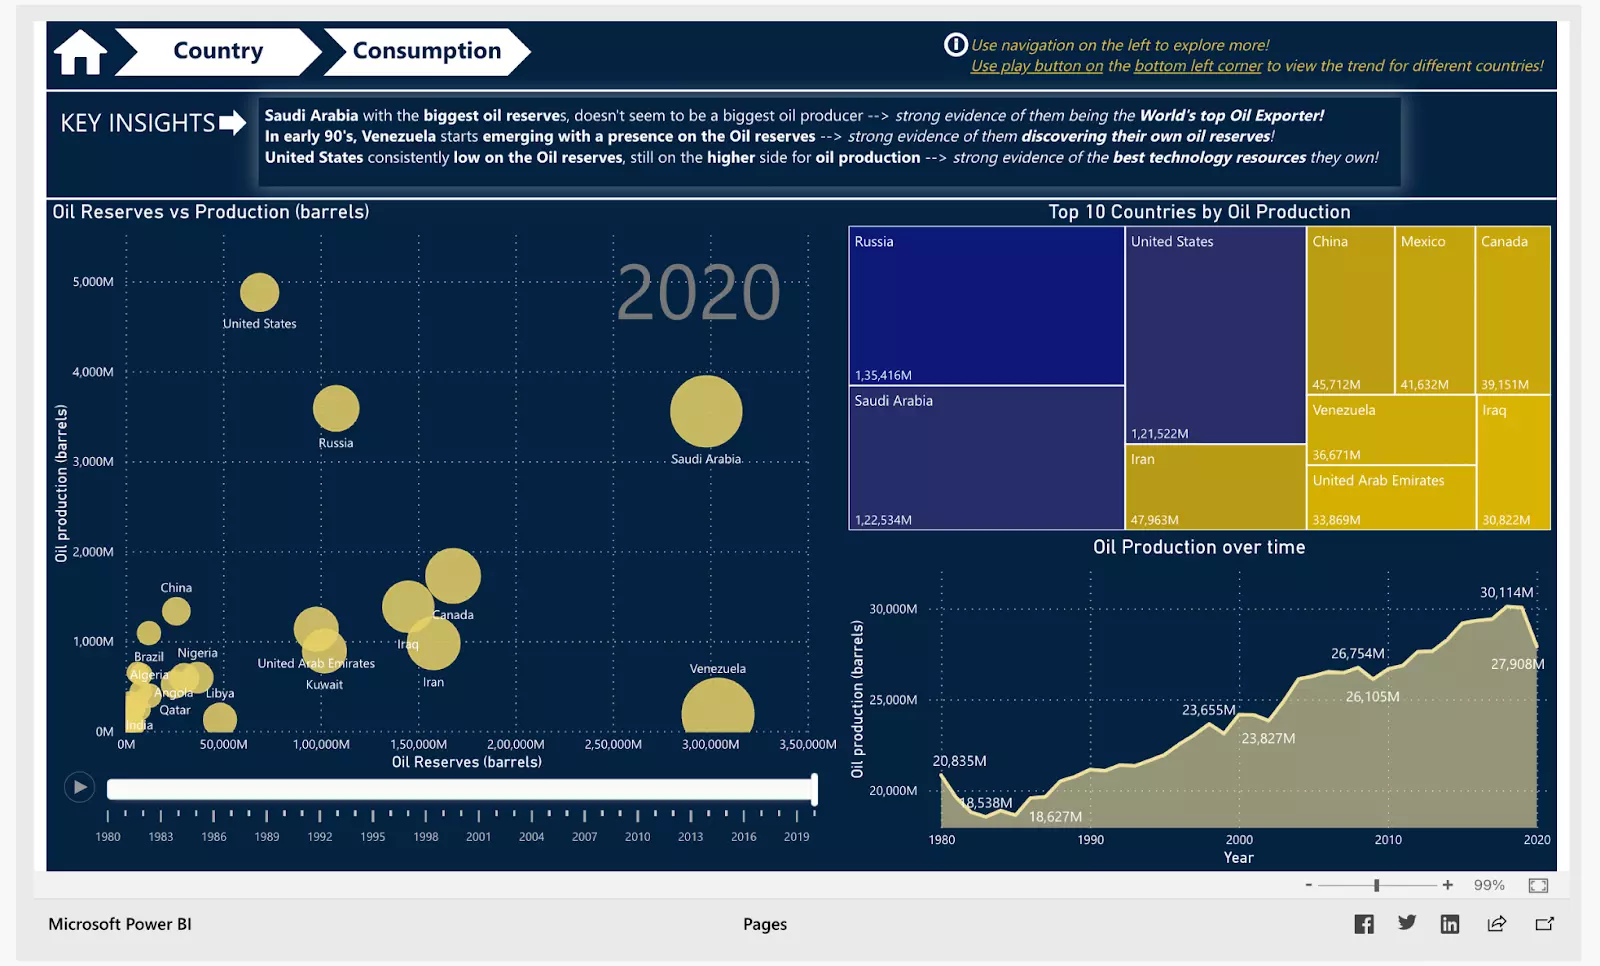
The production tab of this O&G dashboard shows
- The Biggest oil reserves countries
- The total production in each year by countries
- The complete oil production timeline
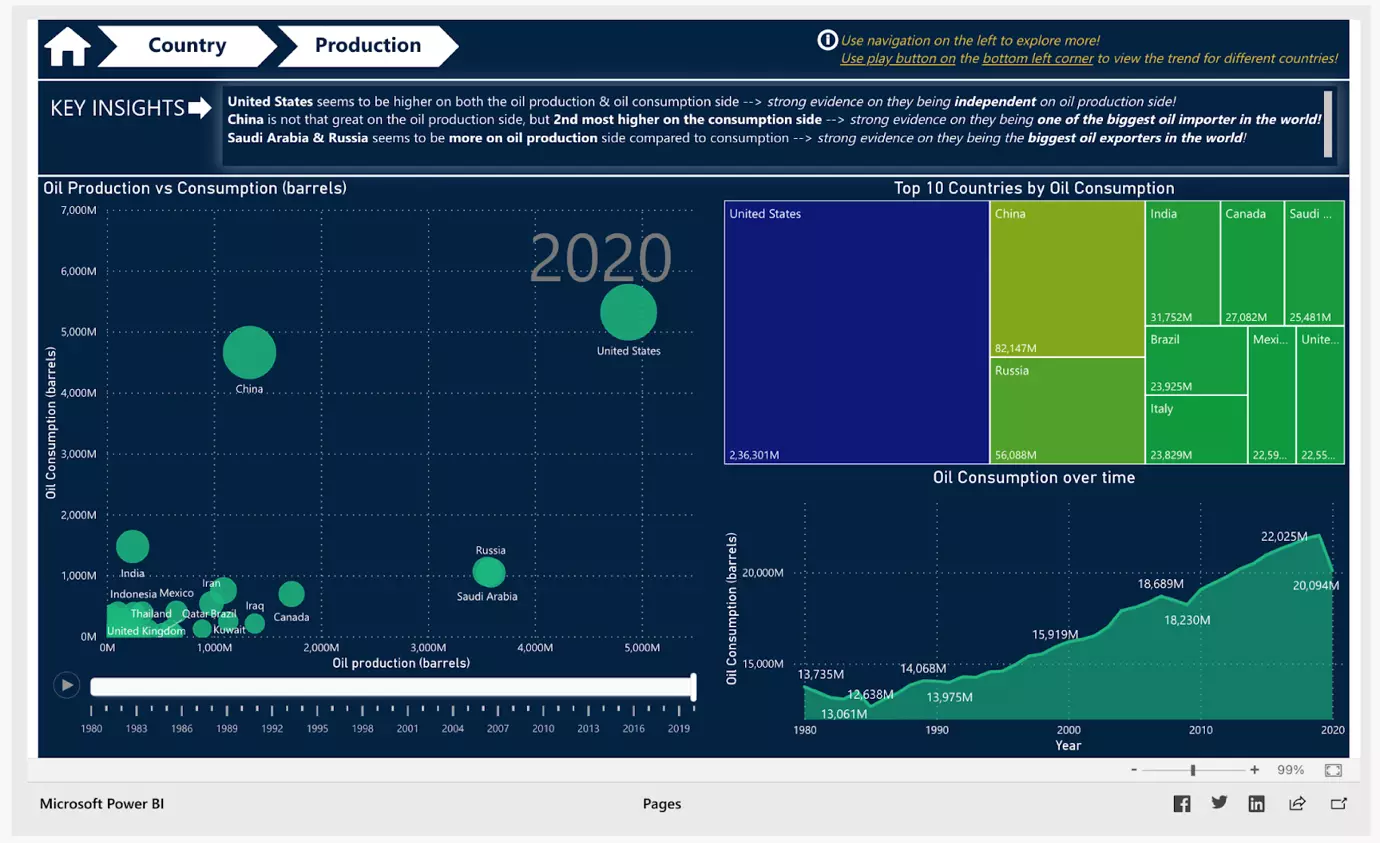
The third tab is about oil consumption figures around the world. It provides key insights into the key performance indicators (KPIs), including –
- Top 10 countries in oil consumption
- Oil consumption timeline from 1960
- Oil consumption and production of different countries
What this dashboard offers
The global oil production and consumption dashboard is a cumulation of statistics for top 3 metrics of the O&G industry. Oil is a scarce resource in our world that is why efficiently managing its reserves is a top priority and a challenge as well.
Source: Microsoft Community
But power BI dashboard development like this can overcome this challenge with accurate and real-time data. Furthermore, it can help with
- Monitoring production and consumption KPIs
- Integrated visualizations
- Tracking oil reserves worldwide
- Deep analysis for production maximization opportunities
What people love about this dashboard
This Microsoft power BI dashboard gives oil business management the Power of business intelligence and data analytics. It increases oil production efficiency across all plants for a company as per their requirements. It also provides –
- Easy data analysis for users with little or no DA experience
- Insightful dashboard for analysis and reporting
- Real-time data information to assist in critical decision making
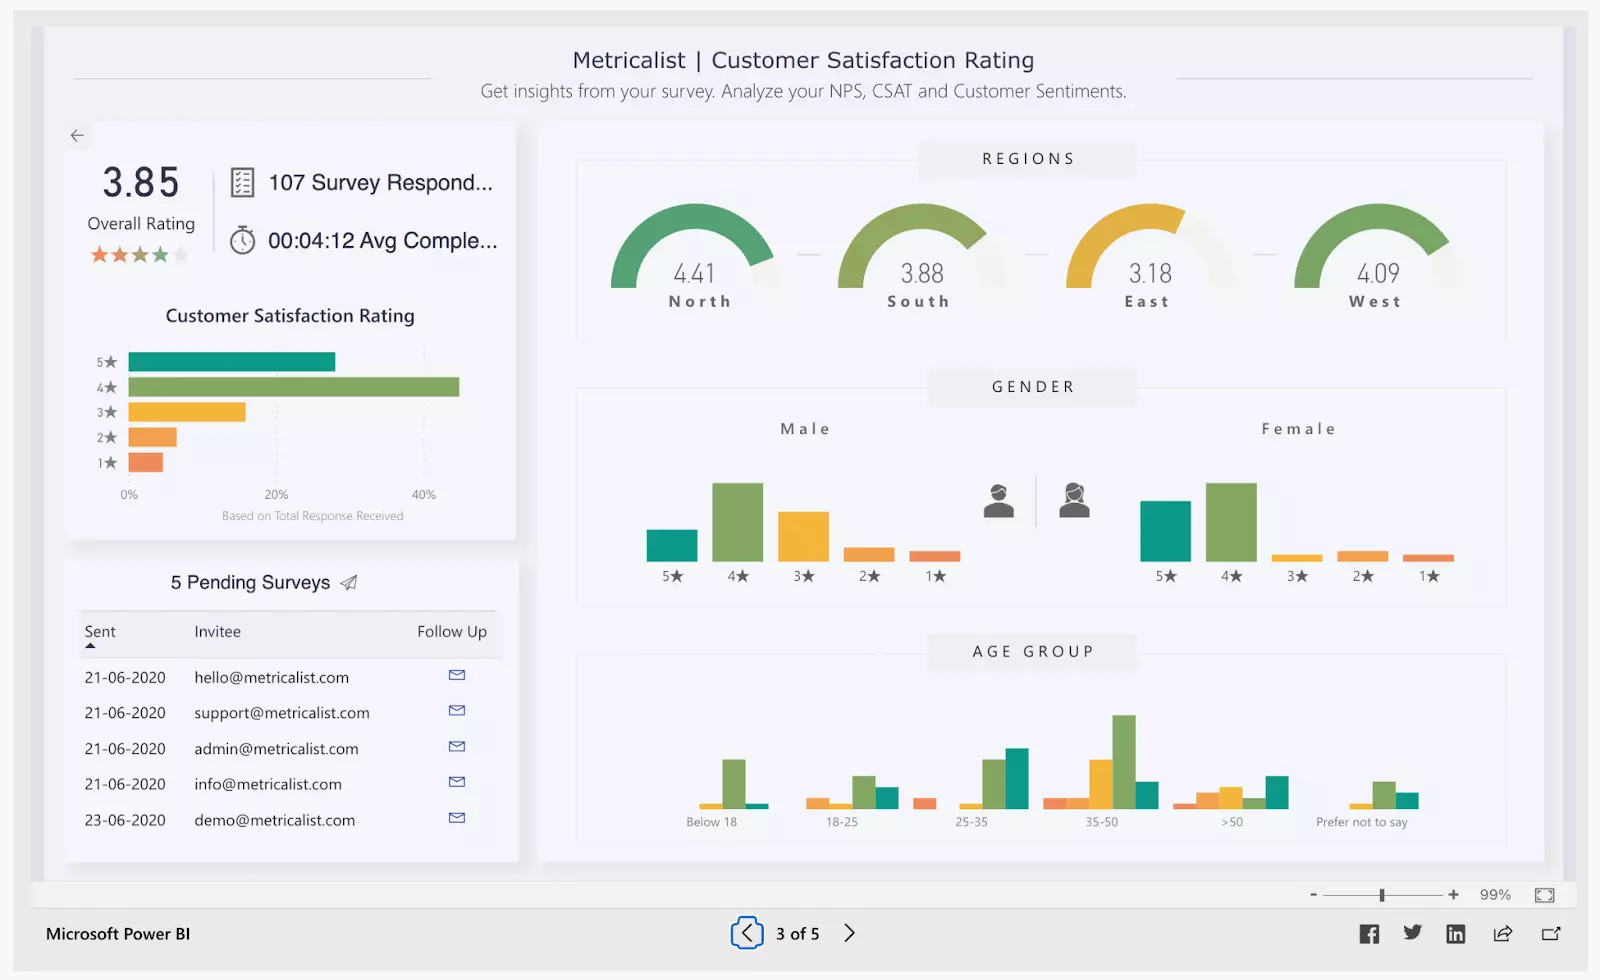
5. Customer satisfaction report dashboard
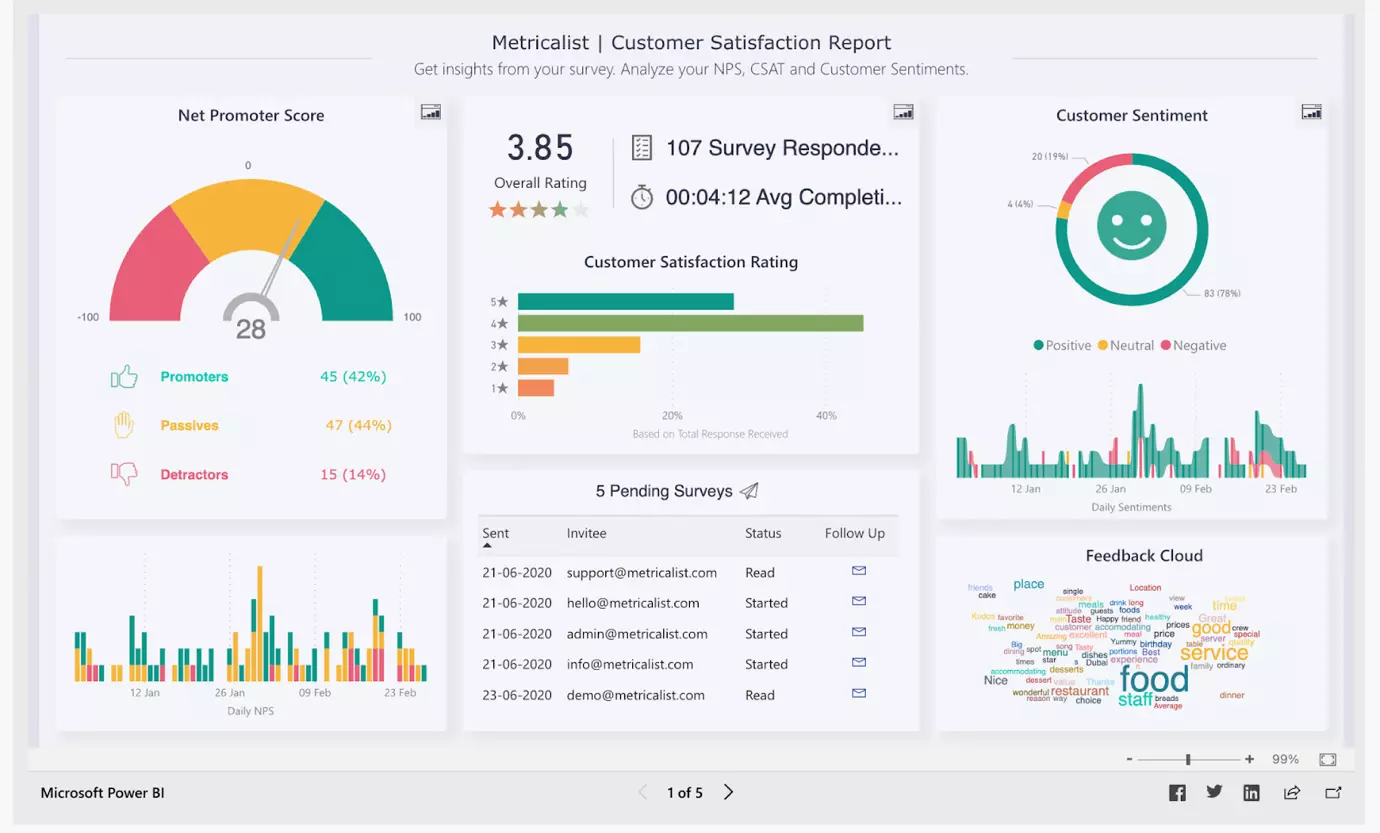
Source: Microsoft Community
This customer satisfaction dashboard is designed to charge a company’s survey analytics. It enables business and marketing managers to perform end-to-end analysis of complete survey data without data scientists. The power BI dashboard includes –
- Net promoter score indicator
- Customer sentiment chart
- CSAT analysis
- Overall rating and surveys taken
The other pages of this dashboard have more detailed statistics and graphs of CSAT and NPS. Let’s look at the CSAT page first.
This power BI template of customer satisfaction report gets insights from surveys for data analytics. It can help business owners and marketing managers to
- Customer response across the region, gender, and age group
- Identify customer satisfaction scores in different segments
- Schedule upcoming surveys
Source: Microsoft Community
What this dashboard offers
The customer satisfaction dashboard contains the selection of consumer responses to help chief/marketing executives make insightful decisions with a deeper understanding of their customer preferences. This sample dashboard can help them –
- Identify segments with the least ratings
- Customer sentiment about the business in color codes
- Analyze survey data on the go

What people love about this dashboard
A summary dashboard like a customer satisfaction report here gives a deep look at the performance of the business region-wise, age-wise, and gender-wise. Although this dashboard is generic, with customized power BI dashboard development, it can be configured for your specific company or business functions. The benefits are
- Cost reduction of crucial survey analysis
- Higher productivity
- Quick glance summary
6. Mobile app analytics dashboard
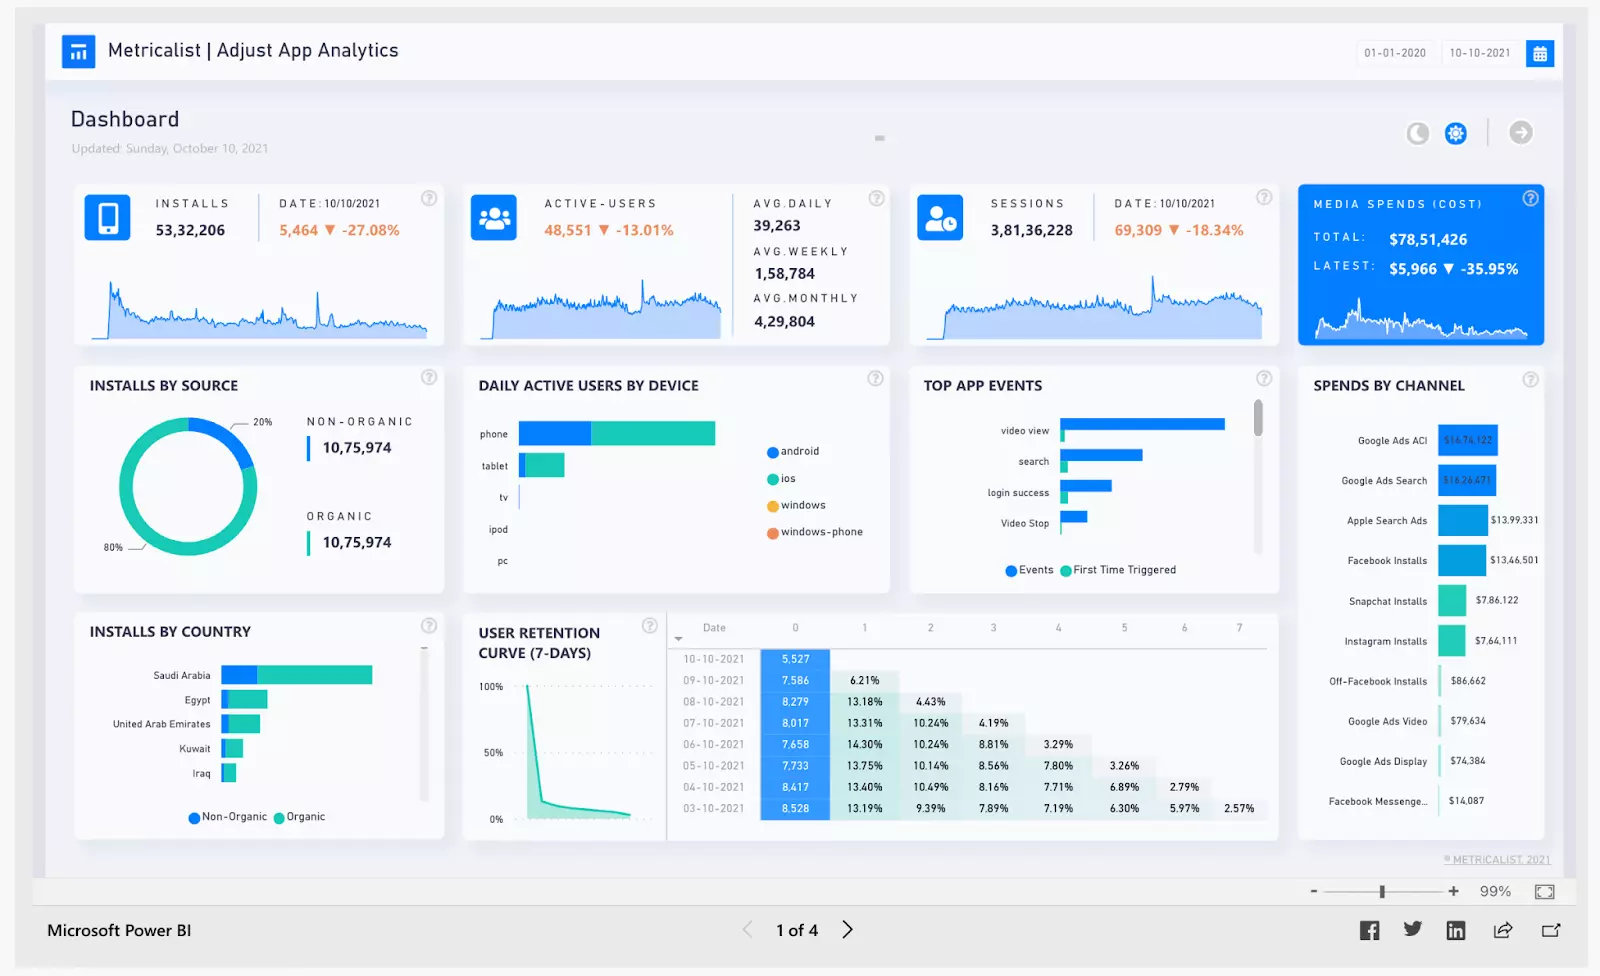
Source: Microsoft Community
It is important to monitor user behavior on mobile apps. For app owners tracking important KPIs is easy with a power BI mobile app analytics dashboard. It is great for marketers, managers, and owners. The homepage of this dashboard has –
- Total no. of app installs
- Daily active users
- User retention
- Sessions
- Top app events
- Spends by channel
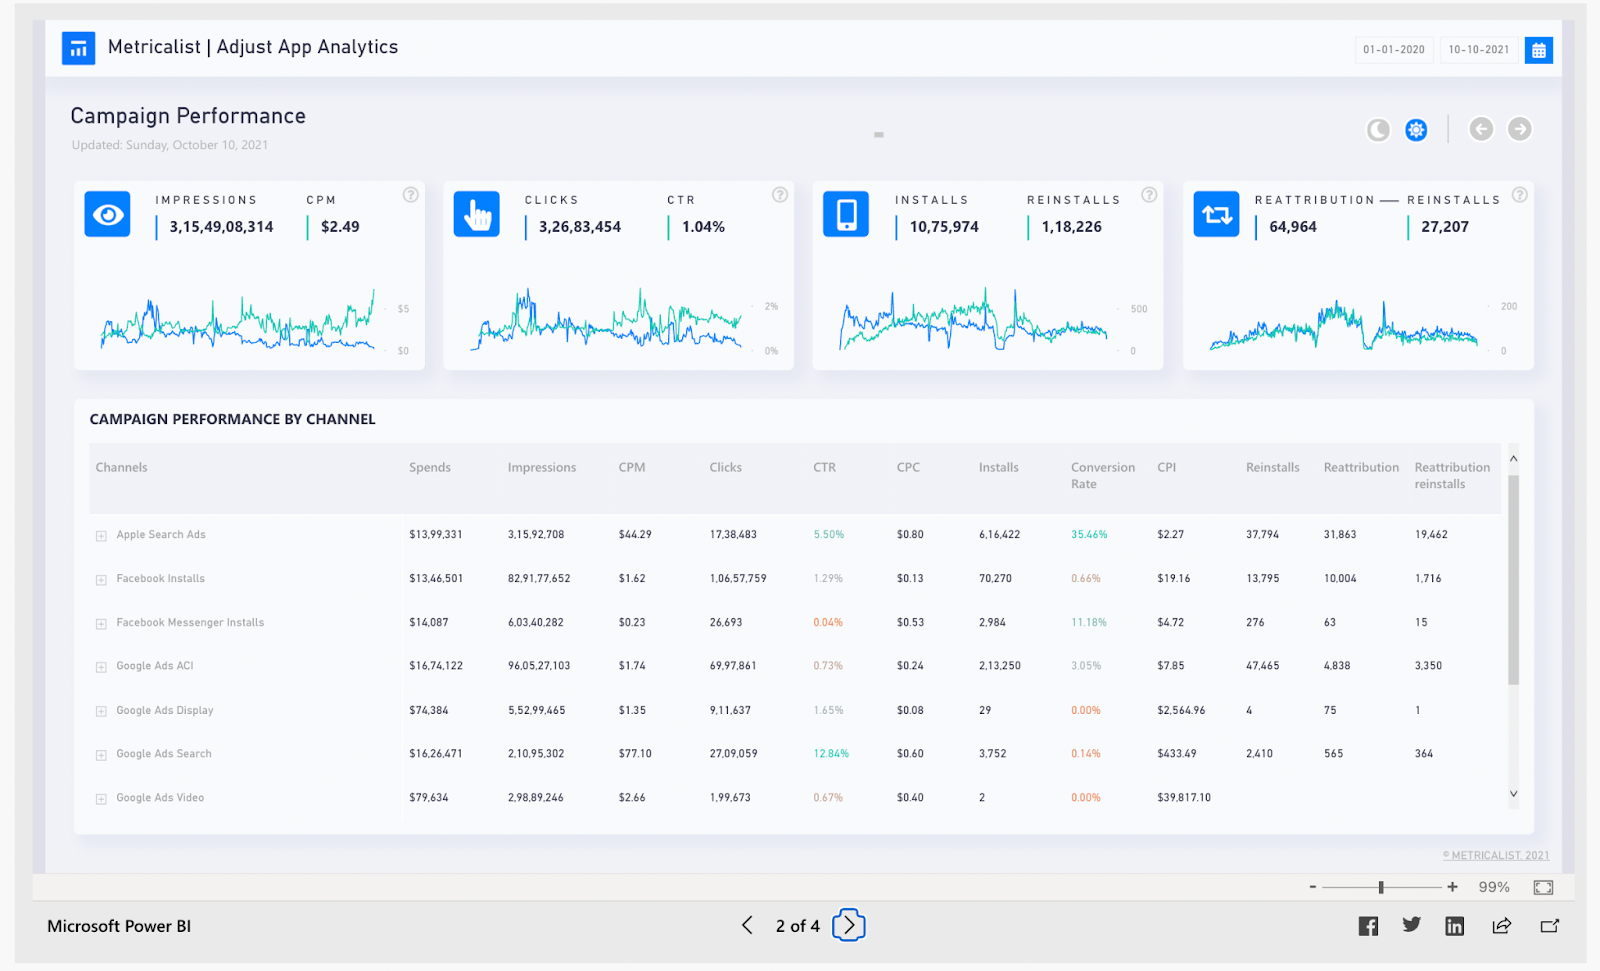
Source: Microsoft Community
The mobile app analytics dashboard brings in all the data of active campaigns on your app. All you need to do is connect the channels to the power BI dashboard. The campaign performance page tracks –
- Impressions
- Clicks
- Installs, reinstalls
- CPM
- CTR
It also tracks all the above metrics for different channels, including Facebook, Apple ads, google, Facebook messenger, and others.
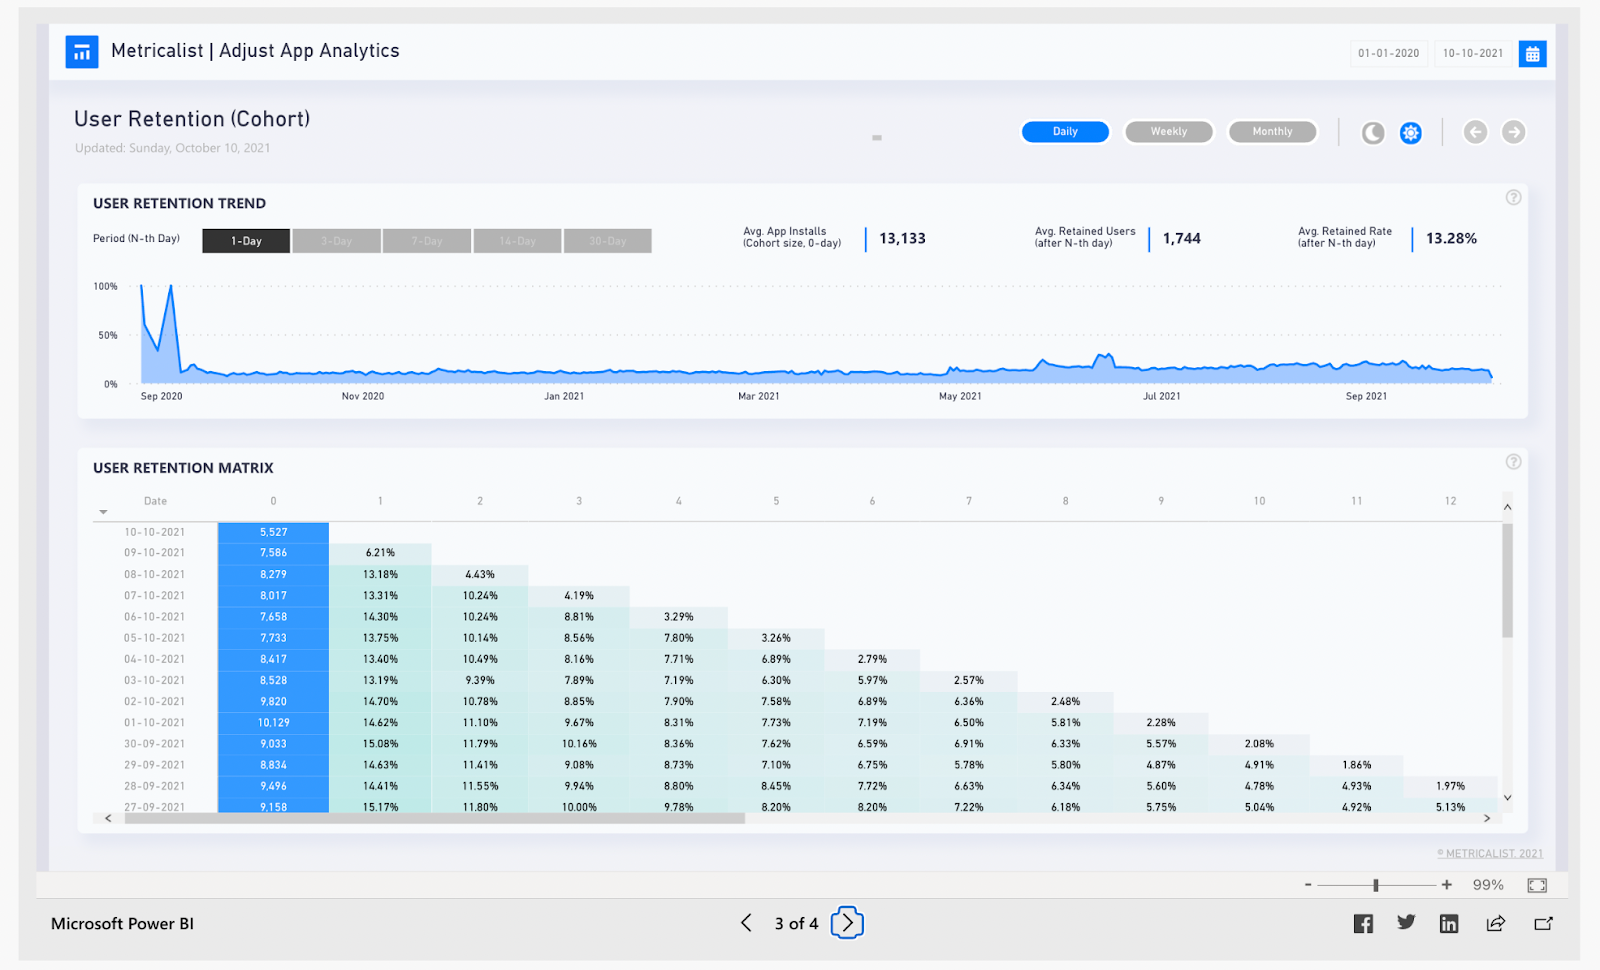
Source: Microsoft Community
The mobile app analytics dashboard carries a variety of insights about user behavior which include –
- User retention trend as per months
- User retention matrix against data of installation and day of using
- Average retention rate
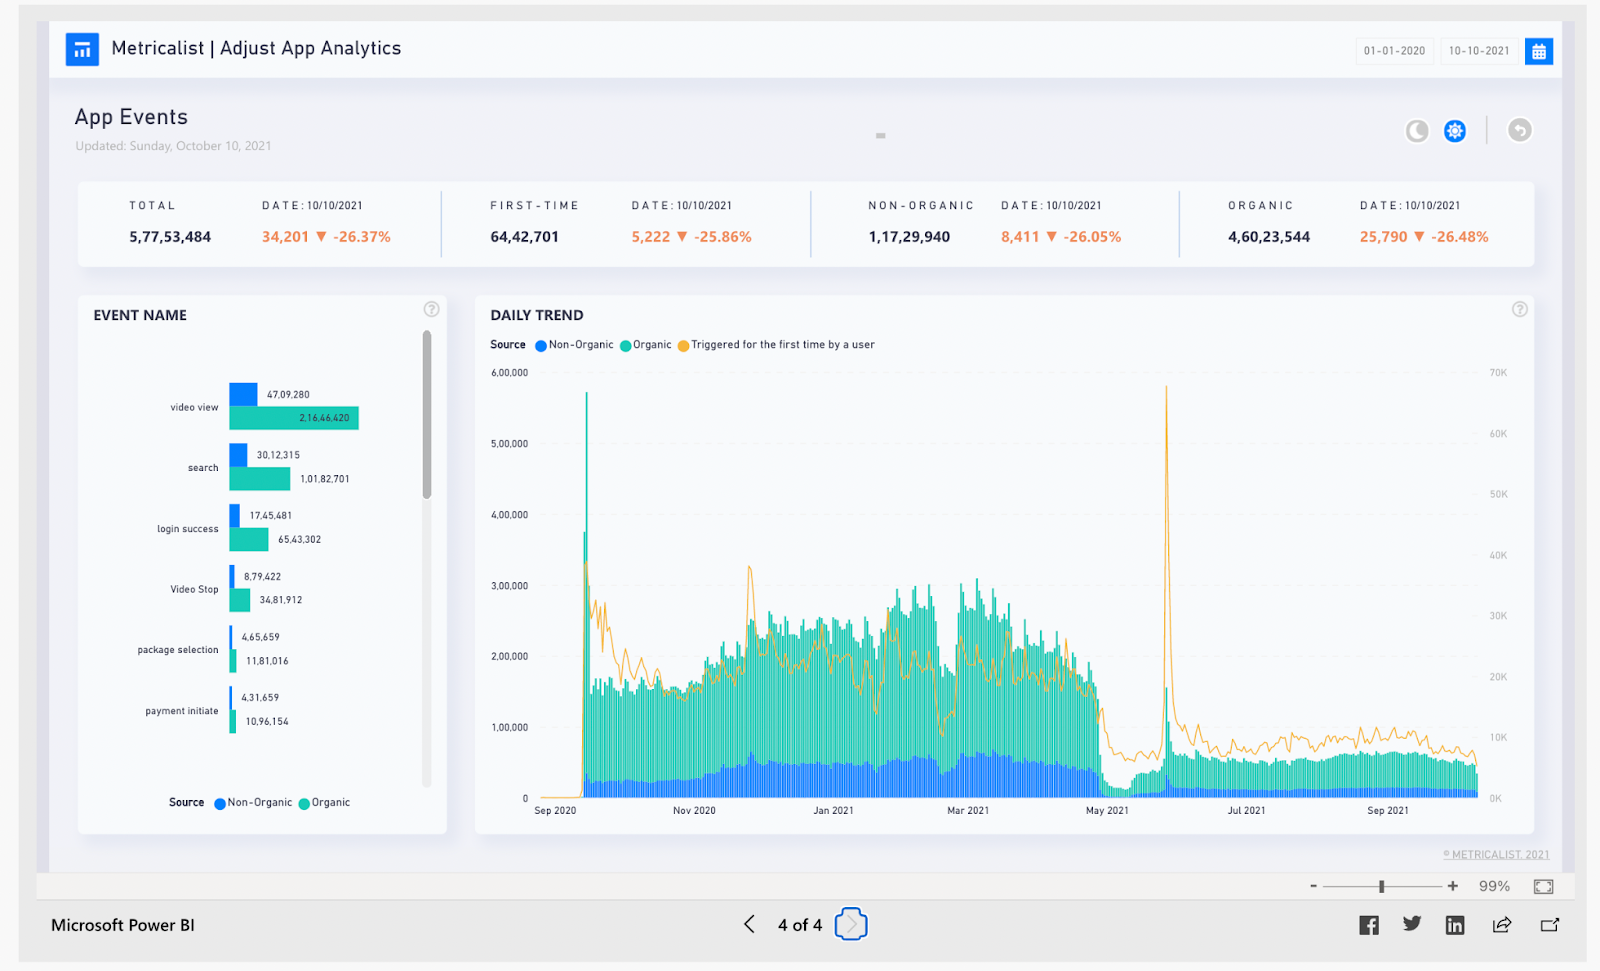
Source: Microsoft Community
The last tab has the data collection of app events like video views, search acts, location tracking, login access, etc.
Also Read: 10 Reasons Why you Need To Switch From Excel To Power BI For Data Analytics
What this dashboard offers
A mobile app KPI dashboard is a convenient way to collect important data and view the key metrics at a glance. It offers deep dive into
- User behavior
- User retention
- App activity and events
- Campaign successes
You can explore app performance and user behavior data by selecting any of the tabs in the report.
What people love about this dashboard
With mobile app monitoring and analytics dashboard, owners and marketers can take a deep dive into user intention and product quality, improve sales, and cope quickly in crisis control. It gives the audience’s opinion about the app. Analyzing the data, they can
- Design new features for better user retention
- Run ads on the most profitable channels
- A/B test a new feature
- Track all user activity to enhance the product
To make your app future-ready, a mobile app analytics dashboard is extremely useful for the owner, marketer, and agency. Our power BI development company can help you make the best of your app data. Contact us for more info.
7. Airline customer survey data dashboard
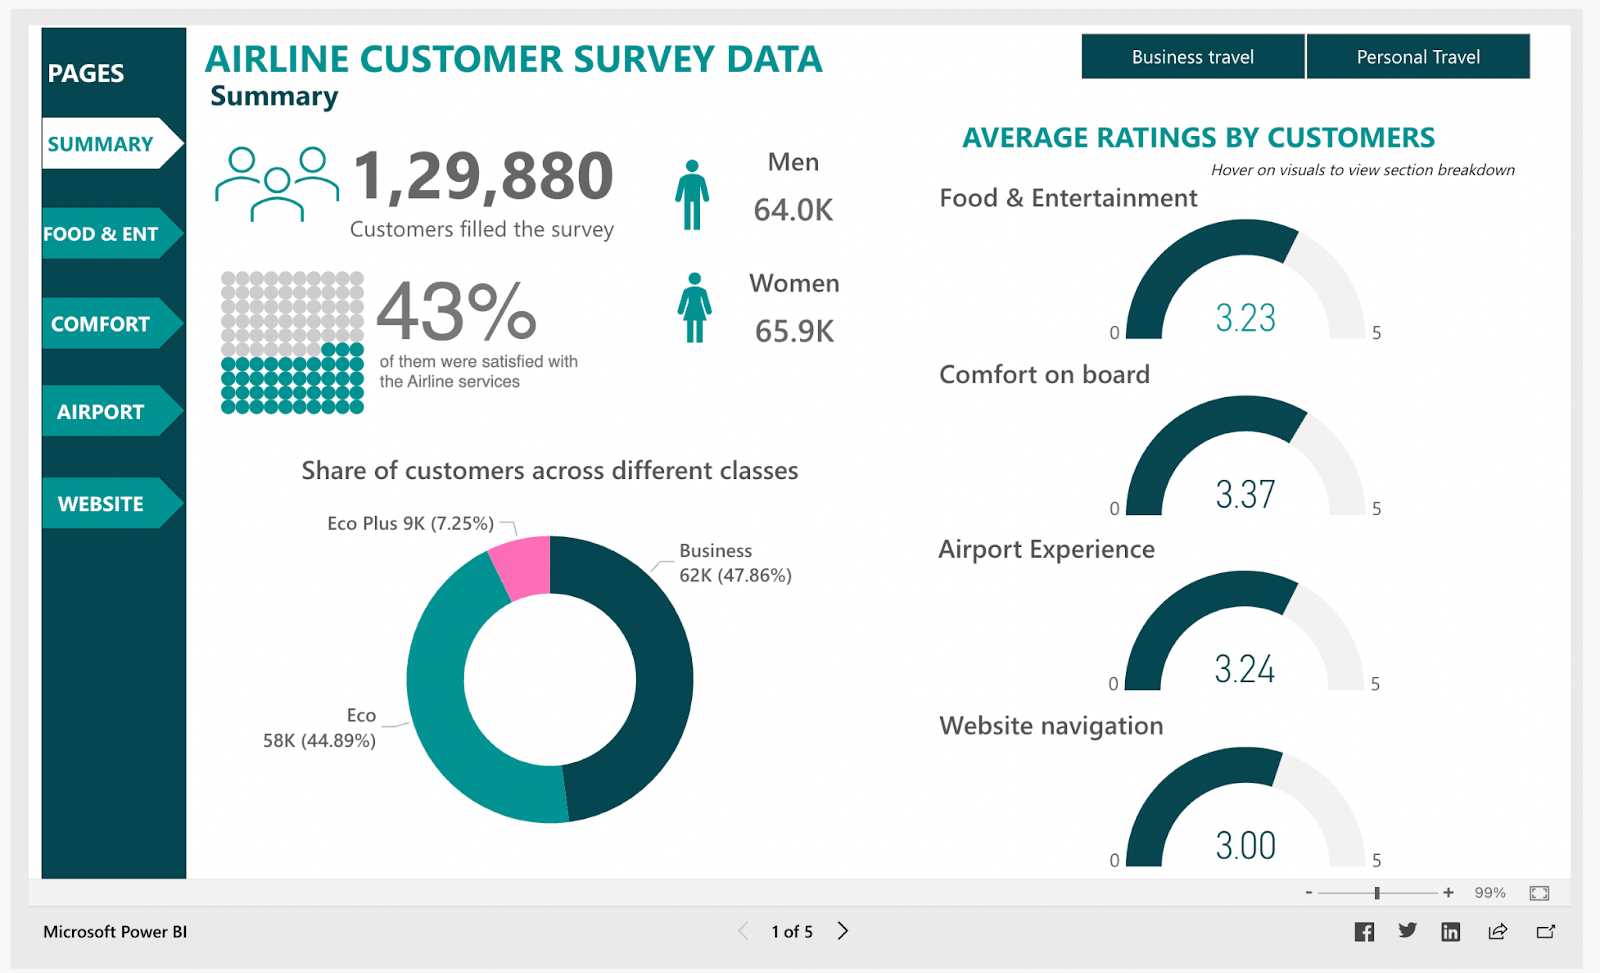
Source: Microsoft Community
The airline customer survey data dashboard gives a user-centric and dynamic view of all critical survey data. Airport management authorities can use these data insights to make quick decisions about
- Passenger satisfaction in food & entertainment
- Effect of changes made at the airport
- Comfort experienced during onboarding
- Website navigation and assistance
The other tabs of this dashboard report on the food & entertainment, the comfort of inflight services (like cleanliness, leg room, seat comfort, etc.), and airport and website experience in easy-to-understand colorful charts. Here is an example of the airport experience report –
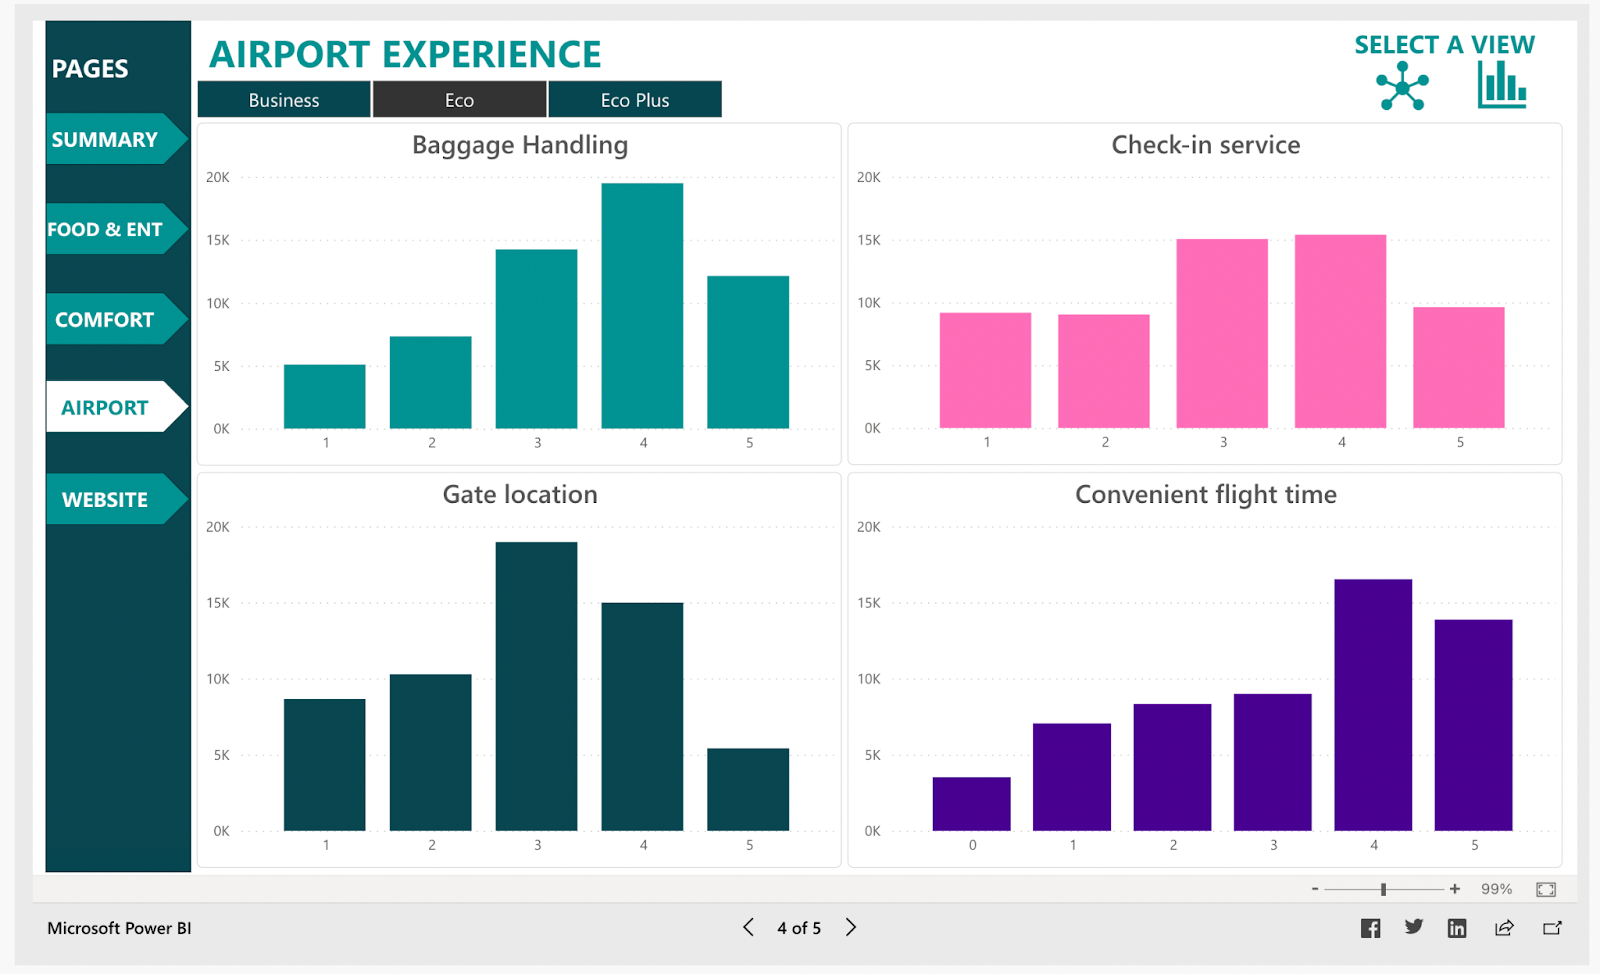
Source: Microsoft Community
What this dashboard offer –
This dashboard provides a quick overview of airport surveys containing key features.
- The total no. of customers who took the survey and the percentage of satisfied passengers are on the summary page.
- Filters to segregate data for eco, eco plus, and business classes.
- A detailed breakdown of survey results for 4 important categories: inflight comfort, airport experience, website ticket booking navigation, food, and entertainment.
What people love about this dashboard
With this dashboard, airport authorities can study staff performance in the airport and inflight. The overall service experience satisfaction index of customers across the three classes can also be studied using the dashboard along with
- Total rating of various services
- Passenger satisfaction statistics
- Airport Staff performance
- Inflight comfort of passengers
8. Email marketing dashboard
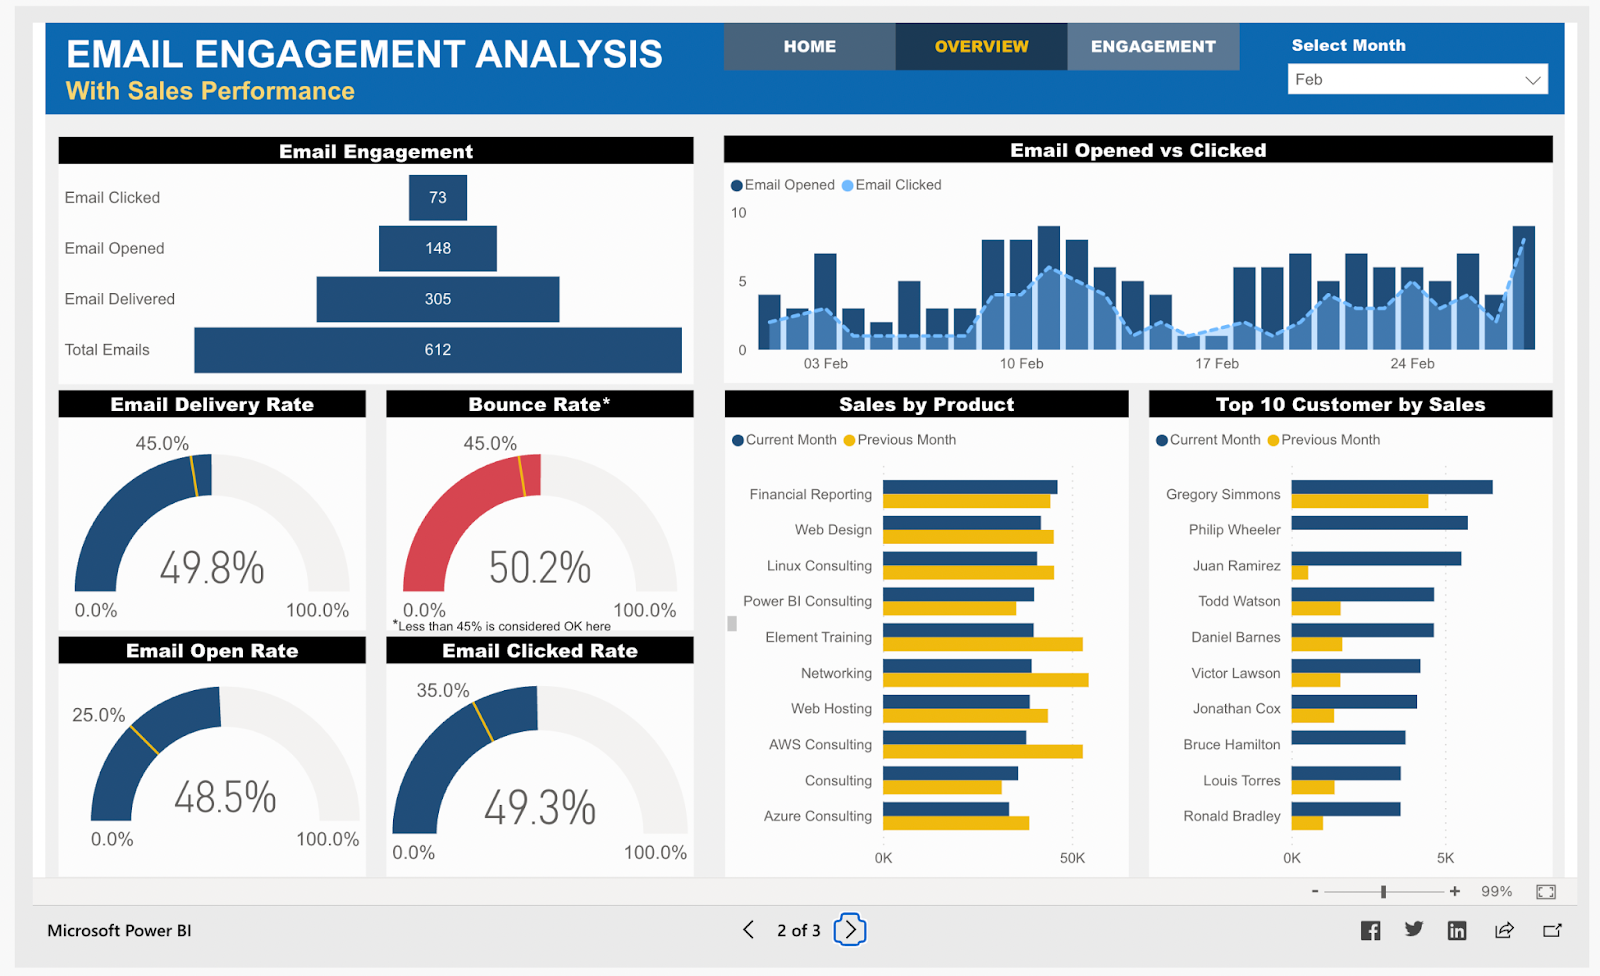
Source: Microsoft Community
The email marketing dashboard offers valuable insights into customer engagement, product sales, bounce rates, top customers, and more. Ecommerce business owners and managers can use this Power BI dashboard to analyze email marketing and sales growth over time. They can evaluate
- Email opened vs. clicked
- Total emails sent and delivered
- Email delivery rate
- Bounce rate
- Email opened and clicked rate
- Top selling products
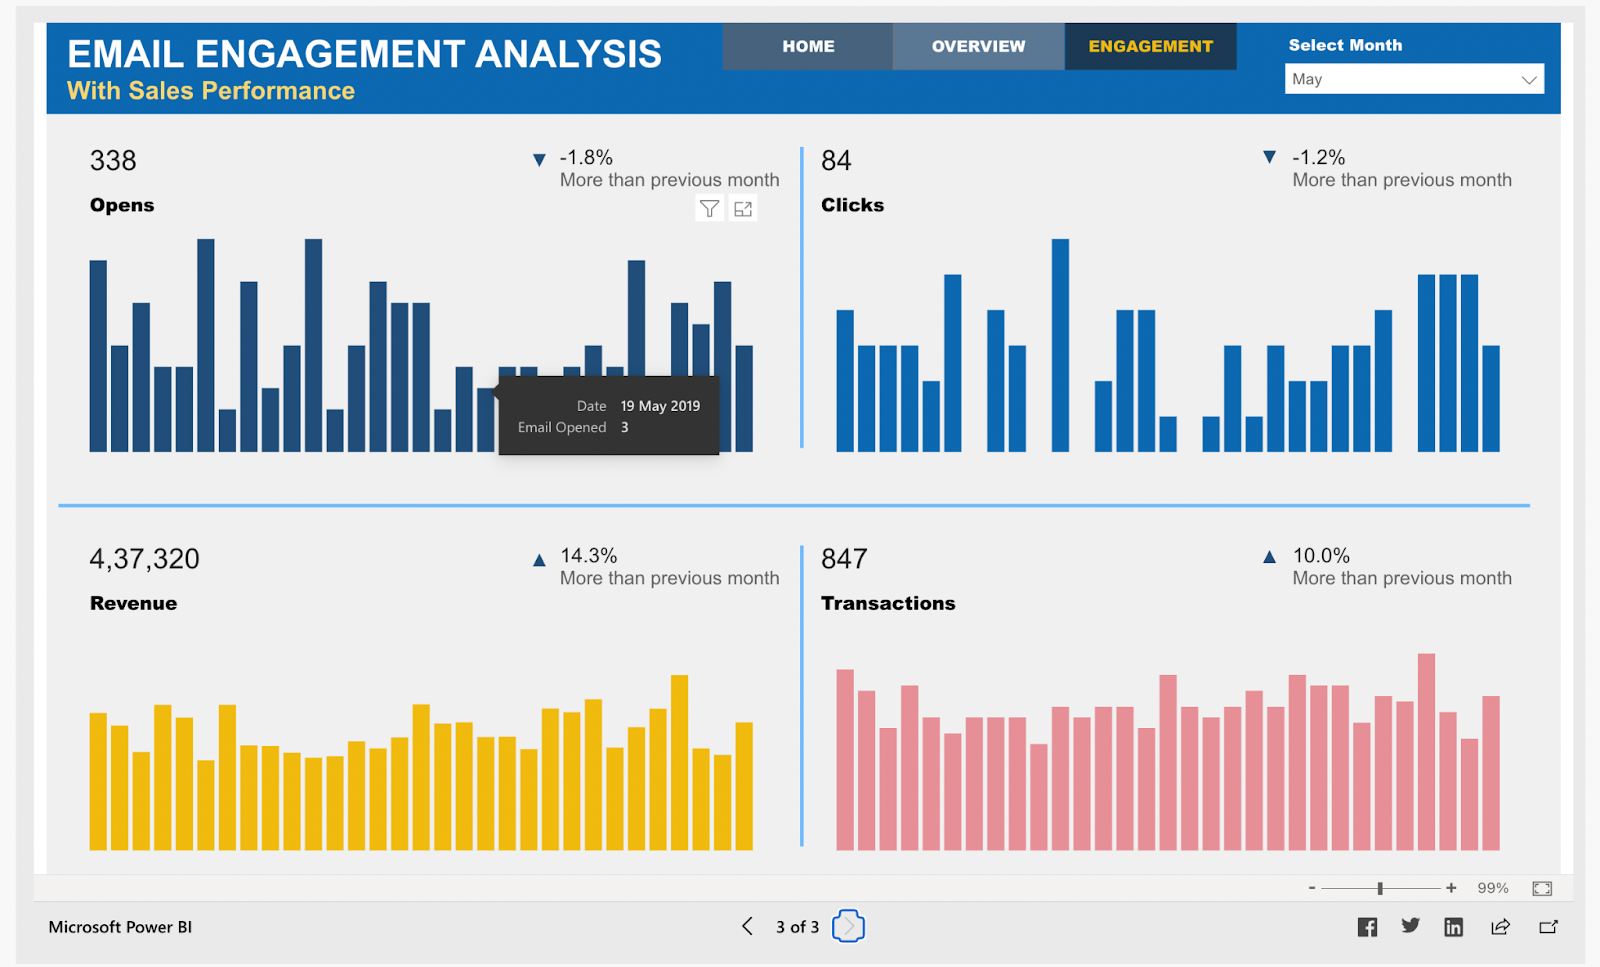
Source: Microsoft Community
The engagement analysis board shows four metrics date-wise; they are
- Emails opened
- Emails with clicks
- Revenue generated
- Total transactions
What this dashboard offers
Email marketing is the most return-generating marketing method. With an email engagement dashboard, business owners can view data to drive profitaBIlity and improve revenue multifold by making intelligent decisions. Managers and business executives can use these charts to
- Compare total sales and profit margins for different emails
- Filter email metrics for all months
- Email-specific growth and profit statistics
- Analyze customer-specific sales and growth
What people love about this dashboard
The dashboard offers actionable insights to small business owners, ecommerce marketers, and executives into key metrics with a single-screen display. The dashboard is
- Useful for both the sales and marketing team
- Great for Customer specific growth
- And has an excellent color combination
This dashboard is built for email marketing stats; with Ecommerce Power BI dashboard development, it can also be modified for other marketing methods.
9. Financial performance overview
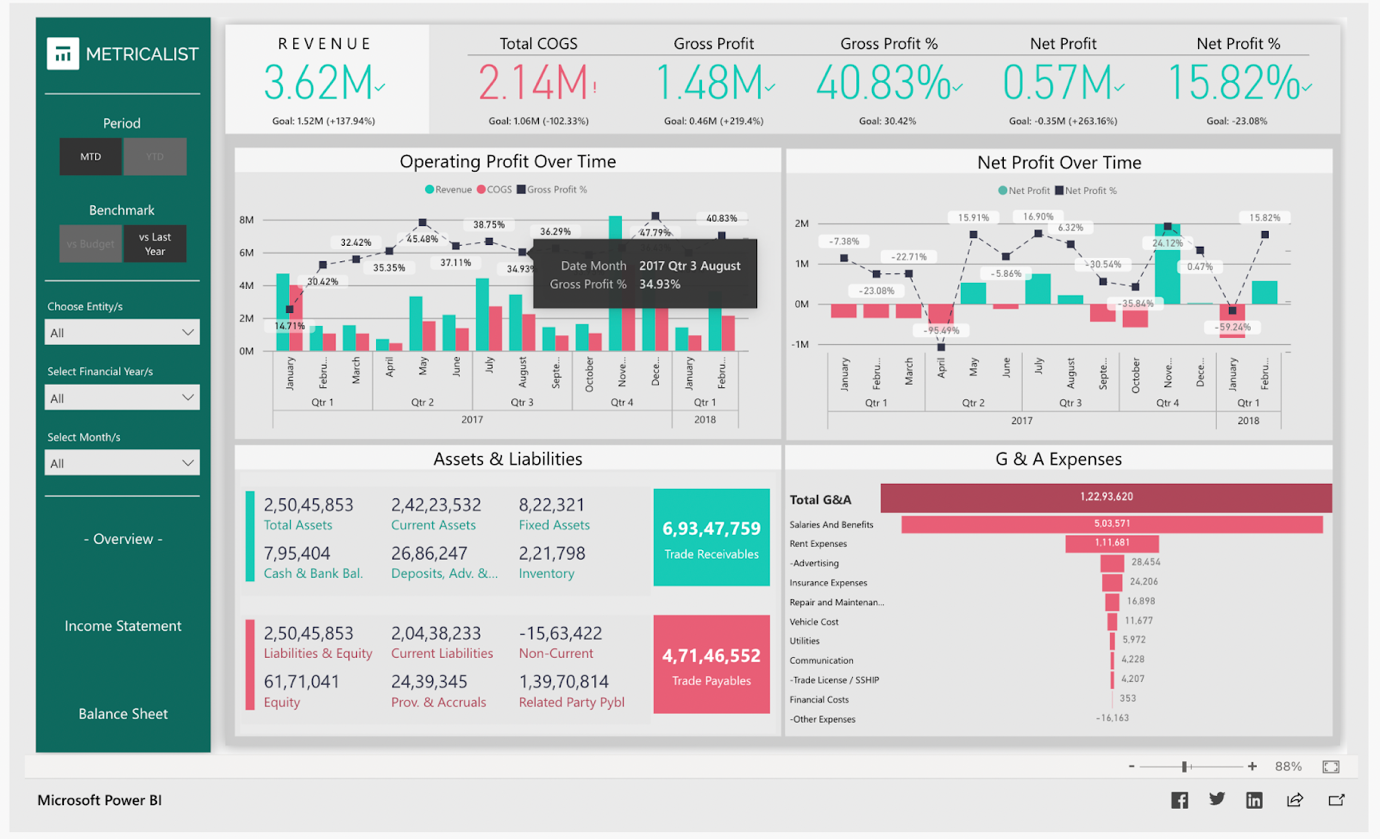
Source: Microsoft Community
The financial performance dashboard contains the following features on a single-screen display –
-
- Major KPIs to track profit and loss
- The monthly trend of income statement
- Comparison of two goals
- Summary of assets, liabilities, and expenses
What this dashboard offers
This dashboard is perfect for firms providing accounting services for clients to deliver financial reporting on time. With a financial performance dashboard, there is no need for the old process of manual tasks, which takes a lot of time. It can
- Extract, load data, and create reports
- Deliver multiple reports instantly
- Aid in the rapid growth of a company
What people love about this dashboard
The financial performance dashboard is a solution to traditional manual financial reporting in excel. Power BI dashboard development empowers companies with an efficient modern tool to track financial health. A power BI dashboard provides
- Accurate financial analysis
- Instant report creation for various metrics
- Access to financial information for decision making
- Yearly goals tracking with accurate financial information
Wrap up
We’ve reviewed some of the top Power BI dashboard examples. The Power BI dashboards can be used for various purposes across industries.
Power BI allows users to connect different data sources and extract and present data in reports. Users can share insights across the company while maintaining data consistency, accuracy, and security.
Business leaders can utilize these dashboards to monitor the performance of their marketing and sales teams, KPIs, human resource analysis, inventory, and many more.

With Power BI dashboards, teams can collaborate on the same reports, discuss insights, and share them through other Microsoft applications like Excel and Teams.
Companies can visualize their data with user-friendly reports and dashboards to uncover profound insights. You must use Power BI dashboards to make the right decisions based on data, putting your company in the driving seat.
Similar Posts

How Power BI Is Making the Energy Industry Energy Efficient
Everything in today’s world runs on energy and its demand is rising exponentially. This energy demand will keep on rising as every industry directly or passively operates on it. ...

Imenso Software Is Awarded The Top Data Analysis Stories Contributor Of The Year 2021 On Hackernoon
Hackernoon is an online publishing platform for the most trending tech stories. More than 25k tech enthusiasts contribute to the website every day. It is among the top trusted sources to get the latest tech info on the internet. Also, with the writer’s society, hackernoon has a dedicated community of readers that hang out on […]...

Data Visualization: Not Data, Decisions Should Drive Business Goals
Believe it or not, this is the age of data visualization. Analysts and Power BI consultants now have a unique approach to data. In today’s age of big data, data analysis is a must-have and makes great sense in the business world....


