Data Visualization: Not Data, Decisions Should Drive Business Goals
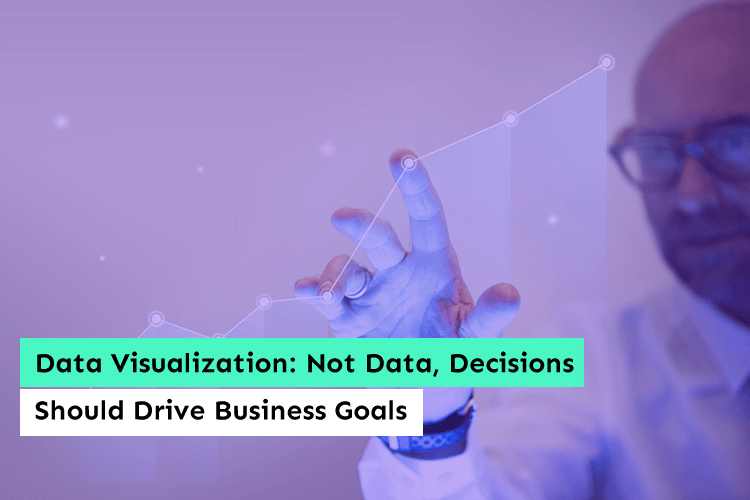
Believe it or not, this is the age of data visualization. Analysts and Power BI consultants now have a unique approach to data. In today’s age of big data, data analysis is a must-have and makes great sense in the business world. Bulk raw data obtained from many sources is being analyzed by analysts to extract meaning – associations and patterns, models and maps, etc. These help in drawing various insights, understanding trends and, most importantly, making decisions from the data, which play a pivotal role in driving business goals.
What is data visualization?
We all know data analysis comes with pretty complex information, and it might not be comprehensible to every common man. However, if the same thing is presented in the form of data visualization, it becomes quite clear and understandable. For data visualization, various modes are used like charts, tables, graphs, and with these, you can have representations of various data points for understanding trends and insights.
Executives are able to get a big picture at once regarding numbers, trends, trouble areas, hot spots, etc. Decision-making becomes convenient for people in varying capacities as they can easily identify the routes which will lead to success.
Also Read: Expanding Your Business? See How Automation Softwares Can Help You Do It Sooner
It is interesting to see that the concept of data visualization has been there for a long time, of course in different styles and manners. From the early 2000s, various innovations have been implemented in data visualization technology. The business world is using Power BI implementation to get the best results.
What are the different data visualization tools?
Data visualization is presented in different formats, which are designed to make information understandable. Data is usually conveyed through graphs, percentages, stop signs, green lights, and many other indicators, which help in communicating various messages. There are both encouraging and discouraging trends that can be seen, and businesses can make moves accordingly.
Basic charts are the most common way of presenting data visualization. There are three kinds of charts used for such purposes – bar chart, line chart, and pie chart. With a basic chart, it is very easy to absorb data in the shortest span of time. Apart from charts, another data visualization tool, which is commonly used by Power BI developer, is the status indicator. In this, various kinds of symbols are used for conveying meaning within a data presentation. Some of the common symbols used in status indicators include gauges and street lights.
How is decision-making improved with data visualization?

When data is laid out in any kind of visualized format, it is easy to analyze information. This helps analysts in gaining the best knowledge from a presentation or study. Visualizations get additional context when they are backed with supplemental and background information. With different kinds of information complementing each other, it is possible to get some winning areas and formulas, which help in the decision-making process for the businesses.
Also Read: Why Data Analytics Solutions Should Be The New Trend SMBs Catch Up On
It is obvious that different problem areas will be there in every business and finding suitable solutions is absolutely necessary. With data visualization, all such pitfalls are put on display along with the positive ones. This gives the analyst a transparent view on which he can make his conclusions and suggest necessary changes at the same time. Data visualization acts as an excellent communication tool, which helps in bringing out both the good and the bad simultaneously. And so most logical conclusions can be taken.
Reasons for using advanced data visualization
With the huge volume of data accumulating every day, it is expected that big total data will pass the almost 50 trillion GB mark in a short span. Without using proper data-management methods and tools, companies and businesses cannot minimize costs and boost profits. This is the reason businesses are availing of Power BI consulting services. Mentioned below are some reasons for which advanced data visualization is used:
1. Improved and complete focus on things that are most important
When there is a combination of contextual information and visualizations, analysts have a glimpse of the whole thing in one go. As a result, they can come to a solid solution and fetch the most important details. Data becomes effectively simplified with the presentation, and the crucial facts take prominence. With every year, businesses will get more and more competitive. As a result, you have to keep a close watch on operating conditions and market performance and see how both are correlated to one another. When data from both fields are analyzed and studied, better decisions can be made for the business.
2. Higher response speeds

When data visualization tools are incorporated successfully into presentations or reports, the available information is enhanced. Analysts are able to collect all the vital information, segregate the positives and negatives, come to logical conclusions and take necessary actions from there on with efficiency and speed. It is needless to say that with proper data visualization, it is possible to save loads of time.
Also Read: Why Do People Prefer Microsoft’s Power BI over Other Data Visualization Tools?
Every person has his own absorbing and natural processing speed, which data visualization supports brilliantly. In data visualization, business analysts can instantaneously see various dimensions of information and how they are related to one another. For professional decision-makers, the process has become easier and simplified. Instant knowledge on matters is obtained, and this definitely gives an edge over the competitors.
3. Option of modification and interrelation with data
The biggest advantage of data visualization is probably that it comes up with actionable ideas, which can be understood and deciphered by all parties involved in the business. Traditional graphs and charts are only means of viewing, but with modern data visualization tools, analysts have the option of interacting with data in any way that they want. In fact, businesses are able to understand many minor issues which impact their performance in a big way.
4. Convenient viewing of patterns and trends
Businesses are highly dynamic today. In traditional data formats, patterns tend to get hidden within the vast pool of available information. Sorting important details and data is quite an arduous job in such cases. However, with data visualization tools, all important details are shown right on the face. There is no need to mine for information from various sources. It is quite easy to understand patterns and trends when they are represented via various graphics or presented in the form of maps, charts, trees, etc.
Also Read: 5 Ways How Logistics Companies Can Increase ROI By Data Analytics And BI
5. Better collaboration between teams
With data visualization, collaboration between teams gets better and smoother. This is because key information regarding all important areas is presented with complete clarity. With such an arrangement in place, decisions are taken quickly and can be implemented within a short span of time.
Conclusion
All the leading businesses of the world are now implementing data visualization for ensuring the growth and development of the organization and taking proper business decisions.
Similar Posts
Why Data Analytics Solutions Should Be The New Trend SMBs Catch Up On
Here is an interesting fact – today, humans produce 2.5 quintillion bytes of data every day. How much do you think it is? It’s 2.5, followed by 18 zeros! Mind-bending right?...
Tableau Vs Power BI: Which Data Visualization Tool Is Better For Your Business
Managing a company’s data is a whole process in itself, from assembling data on a centralized server of all the departments to presenting it for the annual reports. It is a task. That is why big corporations across all industry verticals now have full-time data analysts to study data and abstract insights from it. ...
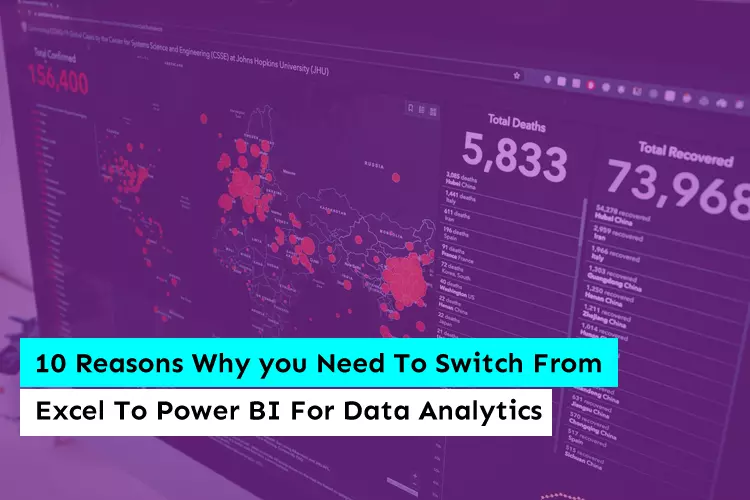
10 Reasons Why you Need To Switch From Excel To Power BI For Data Analytics
Microsoft Excel has been the preferred tool for business reporting for many years. Since 2015, when Microsoft launched Power BI – a “business intelligence” tool that delivers robust analytics and reporting capabilities, it has been simpler to comprehend and visualize complex data. The mindset of business owners began to change their approach and quickly changed […]...


